0
$\begingroup$

This is a follow up question to: Segment/Idenfication of signal from a spectrogram

My main goal is to identify (segment) all of the calls from a given signal. The signal looks like the following (Spectrogram): enter image description here
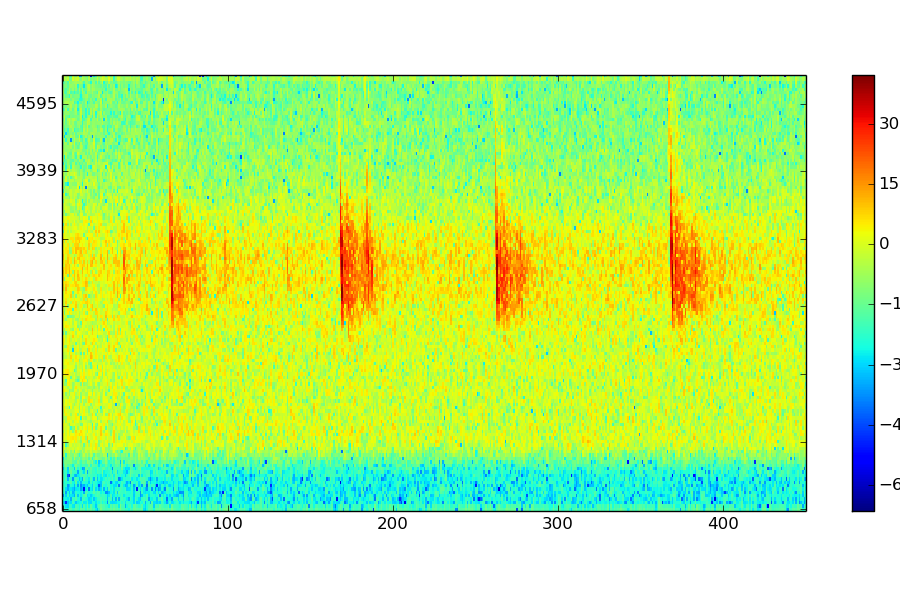
Notice how there are 4 calls within this signal, I would like to identify there are 4 calls and just capture these calls so I can then use this for later analysis.

So far I have carried out the following:

  • Computed an STFT (Spectrogram on the time-signal) of a series of bat calls.

The spectrogram shows where each of the calls are, by the high energy levels.

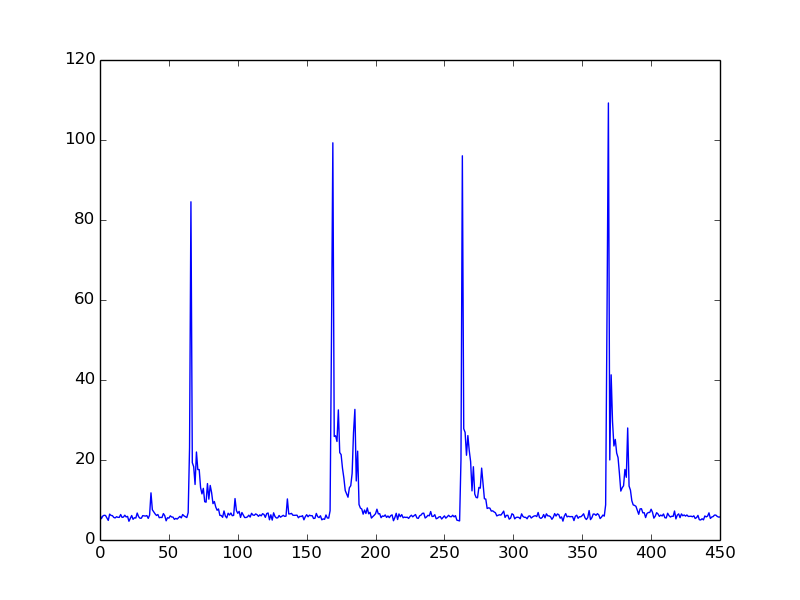
What I am now calculating is the time variance between all of the different calls using the following formula:

$$ T = \sum_a^b x \sqrt{re*re+im*im} $$

This is calculated for each of the bins, the result is as follows:
enter image description here

Where I belive the x axis relates to the time, and the y axis is the total variance

From this, it is clear where the most significant parts of the signal are, the 4 spikes indicate the parts that I need to extract, it's just how... I suppose I could use a threshold value, and state that:

if variance > THRESHOLD:
   keep the block 
else:
   place "0" in each of the elements 

But, how would I calculate the threshold in order to the above? What if the next set of calls are different to the threshold set for this?

Any help would be appreciated.

EDIT:

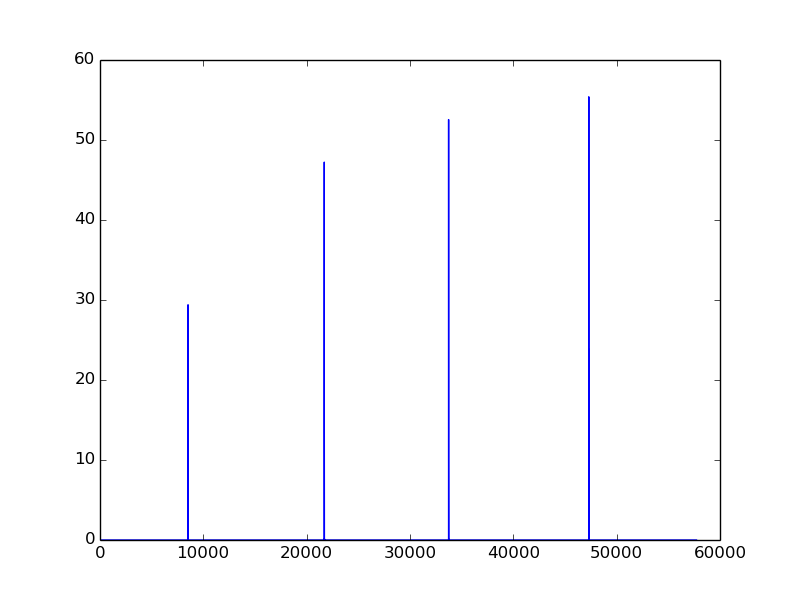
By doing the following (above) and, using a threshold value, I get the following result:
enter image description here

Therefore, can I calculate each of the frequencies (of the bird calls) based upon this? I.e. $$(binnumber * Fs) / NFFT$$

Where Fs is the frequency sample rate and NFFT is the size of each of the bins?

$\endgroup$
1
  • $\begingroup$ @down-voter - Why has this question been downvoted? :s $\endgroup$
    – Phorce
    Commented Jan 30, 2014 at 0:38

1 Answer 1

0
$\begingroup$

You could use a factor $0<c<1$ of the average of the variances

$\mathrm{THRESHOLD}=c\cdot{\operatorname{avg}(\operatorname{var}(X))}$

Since the ,,calls'' (I suppose you're referring to birds) start sharply but fade out gradually, you could extend every period a little in the front and a little more in the end.

$\endgroup$
6
  • $\begingroup$ Hello, please see my updated post! =) thanks for the reply, though! It worked, kind of! $\endgroup$
    – Phorce
    Commented Jan 29, 2014 at 19:36
  • $\begingroup$ I would have expected that you use a lower c to cover more of the signal. But anyways, you should be able to find the peak value. The spectrogram however shows rather broadband signals, so I would not expect the result to be very clear. $\endgroup$
    – user7358
    Commented Jan 29, 2014 at 19:58
  • $\begingroup$ Sorry, what do you mean by lower c what would the c value be in this case? Either way, the values seem pretty clear. On every signal I have tested with; the algorithm is working fine.. Just need to calculate the correct threshold value now $\endgroup$
    – Phorce
    Commented Jan 29, 2014 at 20:02
  • $\begingroup$ @user1326876 - Also, is it possible to plot the frequencies related to the bins? (the way I described in my edit) $\endgroup$
    – Phorce
    Commented Jan 29, 2014 at 20:05
  • $\begingroup$ I just noticed I was talking about $\mathrm{THRESHOLD}=(1-c)\cdot\mathrm{min}(\mathrm{var}(X))+c\cdot \mathrm{max}(\mathrm{var}(X))$. Either way, $c$ is just a weight. Bin index is proportional to frequency, yes. $\endgroup$
    – user7358
    Commented Jan 29, 2014 at 20:10

Your Answer

By clicking “Post Your Answer”, you agree to our terms of service and acknowledge you have read our privacy policy.

Not the answer you're looking for? Browse other questions tagged or ask your own question.