3
$\begingroup$

I wish to isolate a crosswalk from its surrounding, and I thought that as crosswalks have a repetitive pattern of thick white stripes, I might be able to isolate them by measuring their frequency range, and using a band pass filter with the right cut-off frequencies.

The problem is that I have no idea how to analyze the frequency of patterns in images. I know I should run fft2 on an isolated crosswalk, but I don't know what to do with the result.

$\endgroup$

1 Answer 1

2
$\begingroup$

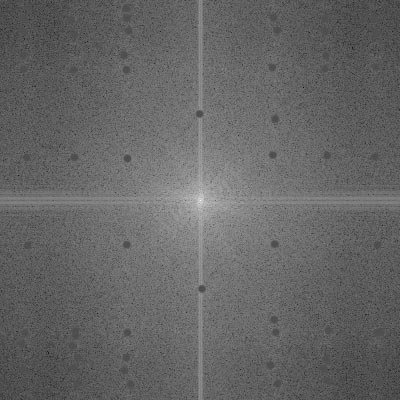
If it is the repetitive pattern, you may observe some strong magnitude at some position in frequency domain. Use imagesc(abs(fftshift(fft2(img)))), you probably would see:

enter image description here

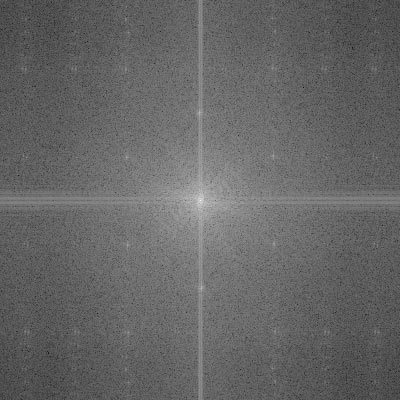
Those small white spots in the image correspond to the repetitive texture that is superimposed on the image. You may then use ordfilt2(F,roi^2,ones(roi)) to find out the roi * roi local maximum of the image. Here F = abs(fftshift(fft2(img))), roi is the region size of interest. Then change those values to zero:

enter image description here

With the real(ifft2(fftshift(F0))) you will recover the image in spatial domain. F0 is the frequency distribution after you implement the white spots removal on fftshift(fft2(img)))

$\endgroup$

Your Answer

By clicking “Post Your Answer”, you agree to our terms of service and acknowledge you have read our privacy policy.

Not the answer you're looking for? Browse other questions tagged or ask your own question.