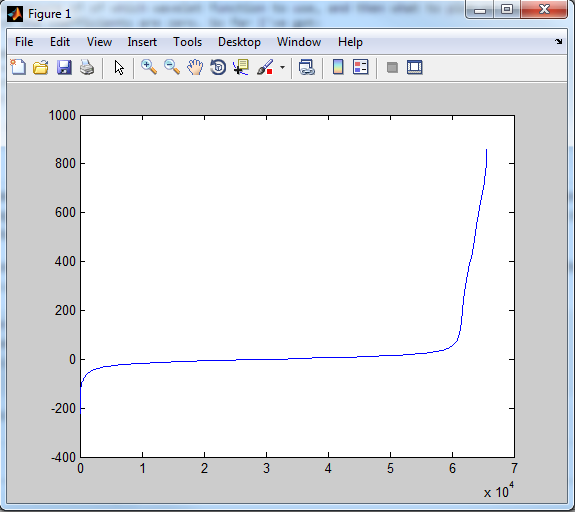
I need to take the wavelet transform of an image (for reference, I will be using Debauchies wavelets, and the test image will either be Lenna or matlabs default woman image),and plot the coefficients in order of their magnitude. This is as an example for a document on compressive sensing I'm writing.
I'm a little unsure of of which wavelet function to use, and then what to plot to best show that many of the coefficients are zero. So far I've got:
load woman
[c,s] = wavedec2(X,2,'db1');
a = sort(c)
plot(a)
Which does have a nice power law distribution:

However, I'm still a little confused and unsure if this image shows what I think it shows.
Could someone suggest an alternative?
