4
$\begingroup$

Question
I've been attempting to resample a GPS signal in MATLAB. I've built a few FIR filters using fvatool and from handmade transfer functions (punched out with a HP-35s). Most are kaiser-windowed LPFs, but some are least-squared LPFs. All of the filters I've built have nominal responses that should adequately filter the aliasing out of the interpolations. I've also built a FFT-Resampling tool that resamples well and very quickly. However, I've hit a strange anomoly, at least as I see it. A simple 'nearest' neighbor interpolation using interp1 seems to much more accurately resample my signal than any FFT-Resampling I have done, or any upsample, filter, decimate tool I've used, to include dsp.FIRRateConverter, resample,upfirdn, and even straight upsample, filter,decimate. Why is this? Can anyone explain why this occurs? My theory is that when the rational integers of your sampling ratio are very close to one, straight interpolation will provide more accurate results because you reduce occilations and/or other noise distortion.

Background
My signal is a standard collected GPS signal, pulled from the air, sampled at 25e6 sps and saved in a binary file using signed 16-bit integers. When pulled into MATLAB (has to be done in chunks due to size) the signal is a complex row vector.

I'm upsampling to 26.25e6 sps, therefore my rational integers p and q are 21 and 20, respectively. To use interp1 I simply build two time vectors:

 t0 = (0:1:numSamples - 1)*1/sampleRate;
 t1 = (0:1:numResamples - 1)*1/resampleRate;

where

 sampleRate= 25e6;
 resampleRate = 26.25e6;
 samplingRatio = resampleRate/sampleRate;
 numSamples = length(s0) % length of my original signal, sampled at 25e6 samples
 numResamples = length(s0)*samplingRatio % length of my sampled signal; should equal length(s1)
 s1 = interp1(t0,s0,t1,'nearest','extrap');

When using a FIR filter, I have used many methods. But the simpliest is to call resample like this (resample is a least squares FIR filter with a kaiser window called through firls that gets pushed through upfirdn):

 s1 = resample(s0,p,q);

where

 [p,q] = rat(resampleRate/sampleRate,1e-12);
$\endgroup$
10
  • $\begingroup$ In what way is interp1(x,Y,xi,'nearest') giving a more accurate resample of your signal? Define "more accurate". Is it that the RMS difference with the known answer is better? nearest chooses the nearest sample, so it will just give you 20 of your original samples and then the 21st will duplicate the 20th, and then repeat. I can't imagine how that could be more accurate than using linear interpolation. $\endgroup$ Commented Jul 2, 2013 at 12:13
  • $\begingroup$ That's correct. The RMS difference between the original signal, s0, and the resampled signal, s1, is much closer when interpolated with 'nearest' than with filtered linear interpolation. For GPS, this is problematic, since the noise floor is so high. It could have something to do with the signal being complex? And your description of 'nearest' is off a little bit; it doesn't duplicate the 21st. 'nearest' takes the mean of the 20th and 21st original samples to produce the resampled 21st sample. $\endgroup$
    – endowdly
    Commented Jul 3, 2013 at 12:22
  • $\begingroup$ By closer I mean the difference is less. Much less. I have also tested with different sampling rates, and I can confirm that as the rational integer ratio approaches unity, nearest neighbor outperforms filtered linear interpolation. However, as the ratio increases away from unity in either direction, linear interpolation is easily the way to go. $\endgroup$
    – endowdly
    Commented Jul 3, 2013 at 12:24
  • $\begingroup$ How can you be taking the difference between the original signal and the transformed signal? The samples don't line up any more. $\endgroup$ Commented Jul 3, 2013 at 12:56
  • 1
    $\begingroup$ You're not measuring difference in a meaninful way. If you compare sample-by-sample on the first 20 samples of nearest-neighber then the samples will be identical. But if you compare $s_{4000000}$ vs $t_{4000000}$ and $s_{4000001}$ vs $t_{4000001}$ you will see that they are completely unrelated. Rather, something like $s_{3809523}$ will be equal to $t_{4000000}$. Linear interpolation (or any other interpolation) is doing some low-pass filtering. You can figure out how much by trying the interpolation function on a pure sine-wave. $\endgroup$ Commented Jul 3, 2013 at 14:54

2 Answers 2

6
$\begingroup$

You are looking at the wrong metric of "correctness". Nearest neighbor is introducing significant discontinuities that are showing up as massive quantities of noise in the result.

The problem is that you should be comparing to the result you would have gotten if you had sampled at 26.25MHz in the first place.

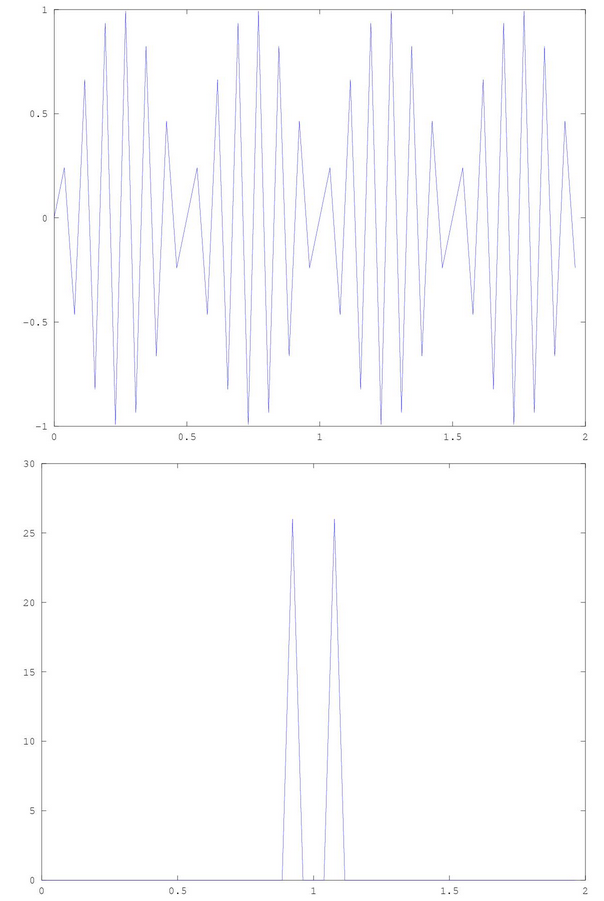
Let's try it (sample a 12Hz sine wave at 26 Hz for 2 seconds):

numResamples = 52;
resampleRate = 26;
t1 = (0:1:numResamples - 1) * 1/resampleRate;
s1correct = sin(t1 * 24 * pi);
plot(t1,s1correct);
plot(t1,abs(fft(s1correct)));

what we want

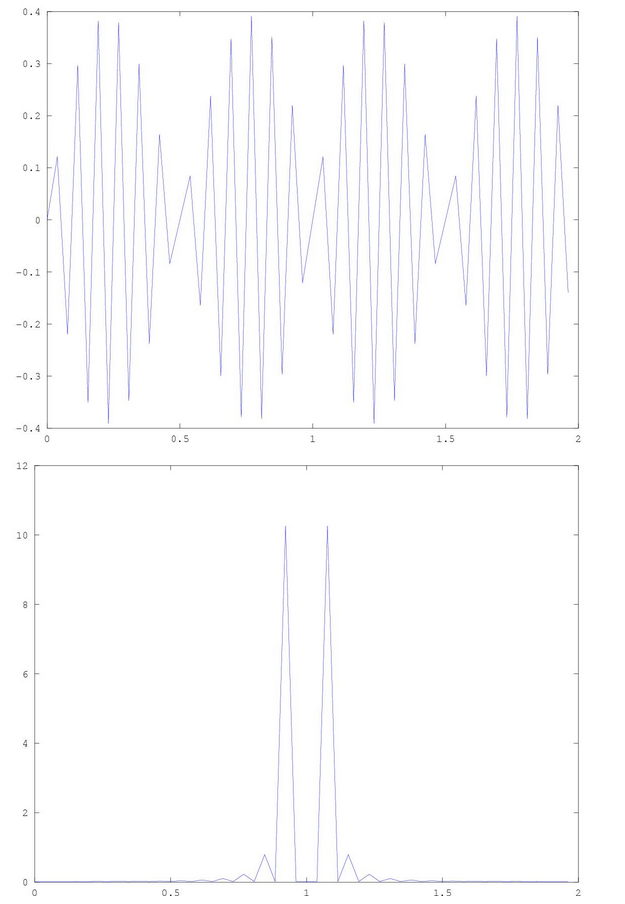
Ok. Now let's see what happened if we had sampled a 12Hz signal at 25Hz, and then interpolate up to 26Hz using matlab's linear interpolation. (Actually, I'm using Octave because I'm on a machine without matlab today)

numSamples = 50;
sampleRate = 25;
t0 = (0:1:numSamples - 1) * 1/sampleRate;
s0 = sin(t0 * 24 * pi);
s1linear = interp1(t0, s0, t1, 'linear', 'extrap');
plot(t1,s1linear);
plot(t1,abs(fft(s1linear)));

linear interpolation

Pretty good. Now let's look at nearest neighbor interpolation.

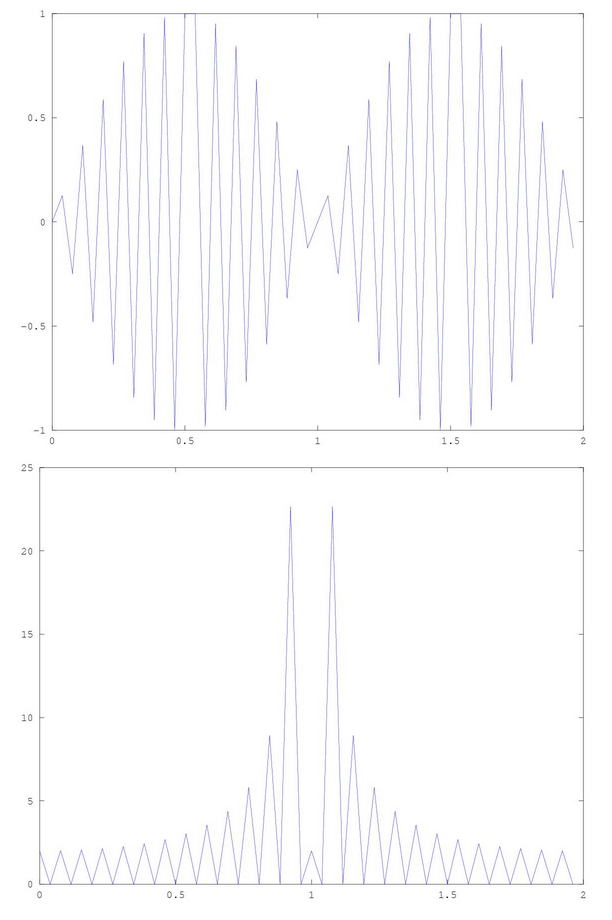
s1nearest = interp1(t0, s0, t1, 'nearest', 'extrap');
plot(t1,s1nearest);
plot(t1,abs(fft(s1nearest)));

enter image description here

It's completely different, and filled with noise at all frequencies!!! (The "beat pattern" in the nearest neighbor result is the beat pattern from sampling at 25Hz instead of 26Hz.) The noise is because nearest neighbor is compressing the 12Hz signal to 12.48Hz, and then inserting an extra sample every 26th sample to get us back to 24 peaks. That extra sample is the discontinuity that is creating all that extra noise.

I think you'll find that cubic interpolation is even better than linear.

$\endgroup$
5
  • $\begingroup$ The purpose for my resampling is to get the transformed signal to be as similar to our original signal, in the time domain, as possible. This is in order for it to be read by an analyser and a reciever properly. If you take the data you provided above, and do a comparison plot at the same time, plot(t0,abs(s0),'k',t1,abs(s1correct),'-.r.',t1,abs(s1nearest),'-.b.'); you can also observe the effect I describe. Also, please try this with a more analogous signal to GPS, such as s = complex(randn(1,n),randn(1,n));. I'd be interested to see if you observe the same behavior that I do. $\endgroup$
    – endowdly
    Commented Jul 5, 2013 at 14:34
  • 2
    $\begingroup$ Again: comparing s0 to s1nearest is meaningless. The valid comparison is s1correct to s1nearest. The original signal is continuous and you should try to achieve the closest match between the continuous signal and the 26.25MHz discrete signal. Comparing the 26.25Mhz discrete signal to the 25MHz discrete signal is a mistake. $\endgroup$ Commented Jul 5, 2013 at 18:09
  • $\begingroup$ Going back to the GPS signal... it is discrete. I am not concerned with the continuous transmission. I am only concerned with the 25 MHz digital signal and how close I can make my 26.25 MHz signal the same in the time domain. I have 7 minutes of a discrete digital signal affected by doppler and DSSS. Does this make more sense as to why comparing s0 to s1 is ESSENTIAL. s1correct is useless in this case; the reciever needs the signal to be s0 at the proper number of samples in time. That is s1nearest. The very slight discontinuities at 26.25 M samples is negligible. $\endgroup$
    – endowdly
    Commented Jul 8, 2013 at 12:56
  • 1
    $\begingroup$ @endowdly Wandering Logic is right. You would do well to listen to him. $\endgroup$
    – Jim Clay
    Commented Jul 16, 2013 at 14:43
  • $\begingroup$ Yes, grandfather @jim clay ... $\endgroup$
    – endowdly
    Commented Feb 13, 2014 at 6:21
3
$\begingroup$

I'll start by saying I don't know anything about GPS, but I believe WanderingLogic has answered the question correctly and I'll see if I can illustrate this with a simplified problem.

Let's say the original transmitted signal is a simple sine wave of 1Hz. This will analogous to the transmitted signal from the GPS satellite, and by the way this is the continuous signal that WanderingLogic is referring to.

You have 2 receivers, one samples the transmitted signal at 5Hz, the other samples the signal at 6Hz. Both of these signals are now discrete representations of that continuous 1Hz signal.

Because the fundamental sample timing is different, you cannot compare the 5Hz discrete samples to the 6Hz samples, none of them were taken at the same point in time and therefore (except for 0) none of the 5Hz values are in the 6Hz data and vice versa. You could upsample the 5Hz waveform to 6Hz, but because of the discontinuities that WL described and showed above, the resampled 5Hz waveform will be noisier than if you had just sampled at 6Hz. I know that part is not what you asked, but it's just for some clarification.

What you are doing with the upsampling of your 25MHz signal to 26.25 is the correct way to do it, but I think your comparison of 25 to upsampled 26.25 waveform is where you are getting crossed up. The continuous signal that was transmitted is ultimately what you are trying to match, not your original 25MHz sampled waveform.

$\endgroup$
3
  • 2
    $\begingroup$ One nitpick with your example: there will be times at which the samples from the two receivers line up. Specifically, the 6th sample from receiver 1 (at 5 Hz) and the 7th sample from receiver 2 (at 6 Hz) will both correspond to $t=1\ \text{sec}$, assuming that the first sample is at $t=0$. $\endgroup$
    – Jason R
    Commented Jul 16, 2013 at 15:38
  • $\begingroup$ Thank you Jason, I changed sample rates in my response so many times trying to simplify, I confused myself. $\endgroup$
    – user5026
    Commented Jul 16, 2013 at 19:48
  • $\begingroup$ I wish I could have made it more clear in my question but I wasn't trying to compare received data or two separate waveforms at different sampling rates. I was trying to make a data stream that was captured at 25 Ms to "look" exactly like (in the time domain) the same exact waveform in the same time span but with 26 Ms. $\endgroup$
    – endowdly
    Commented Feb 13, 2014 at 6:20

Your Answer

By clicking “Post Your Answer”, you agree to our terms of service and acknowledge you have read our privacy policy.

Not the answer you're looking for? Browse other questions tagged or ask your own question.