1
$\begingroup$

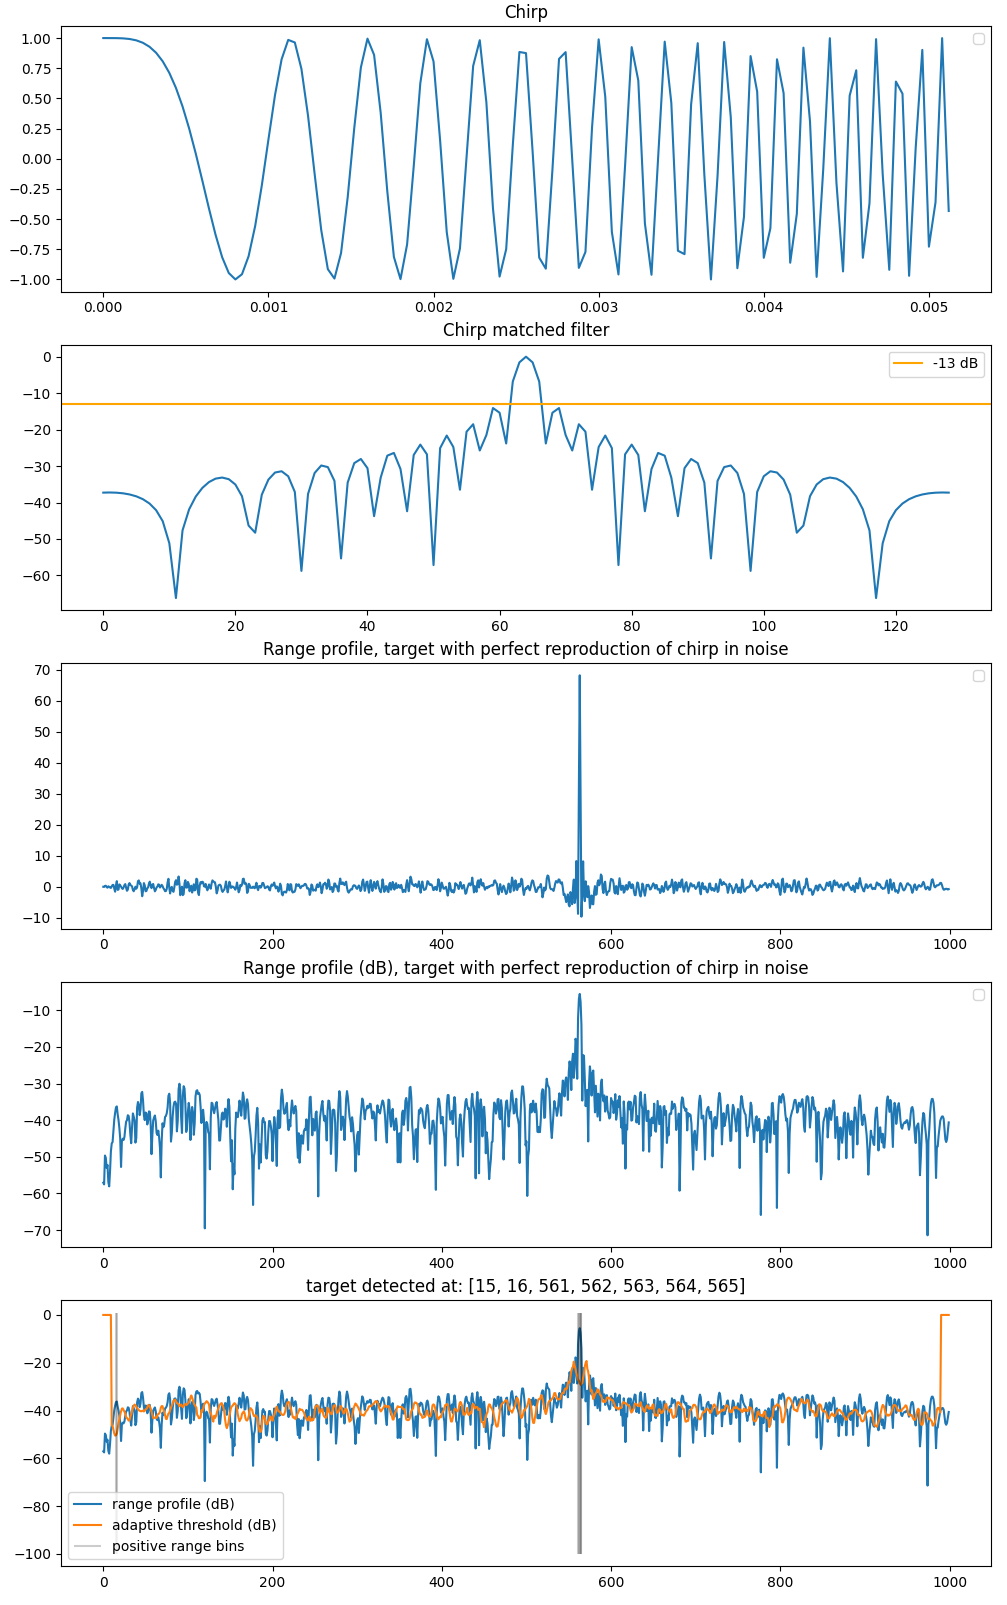
I implemented a Python CA CFAR test for a linear chirp but I arbitrarily chose the number of guard and reference cells. I'm now wondering how to properly choose the CA CFAR parameters (number of guard and reference cells, dB threshold) and how to check whether the resulting $P_d$ and $P_{fa}$ make sense. Here is my code and figures:

import numpy as np
import matplotlib.pyplot as plt

fs = 25e3 # signal=range cell sampling frequency
f = 8e3 # chirp bandwidth
T = 129/fs # TX time = chirp duration
t = np.arange(0,T,1/fs)
chirp = np.exp(2j*np.pi*(f/(2*T))*t**2)
MF = 20*np.log10(np.convolve(chirp, np.flip(np.conjugate(chirp)), "same") / np.sum(np.abs(chirp)**2))

# create RP
nbr_fs_range_bins = 1000
idx_target1 = 499
RP = np.zeros((nbr_fs_range_bins))
RP[idx_target1:idx_target1+chirp.shape[0]] = chirp
complex_noise = np.random.normal(loc=0.0, scale=0.1, size=RP.shape) + 1j*np.random.normal(loc=0.0, scale=0.1, size=RP.shape)
# noise added to each range cell corresponding to sampling frequency, AND NOT to range resoluton 1/bandwidth
RP = RP + complex_noise
RX = np.convolve(RP, np.flip(np.conjugate(chirp)), "same")
RX_dB = 20*np.log10(RX / np.sum(np.abs(chirp)**2))

def RP_ca_cfar(RX_dB, n_guard_cells, n_avg_cells, threshold):
    ca_cfar_thresholds = np.zeros_like(RX_dB)
    positives_positions = []
    for idx in range(n_guard_cells+n_avg_cells, RX_dB.shape[0]-n_guard_cells-n_avg_cells):
        left = RX_dB[idx-n_guard_cells-n_avg_cells:idx-n_guard_cells]
        right = RX_dB[idx+n_guard_cells:idx+n_guard_cells+n_avg_cells]
        avg = (np.mean(left)+np.mean(right)) / 2
        ca_cfar_thresholds[idx] = avg
        if RX_dB[idx] - avg > threshold:
            positives_positions.append(idx)
    return ca_cfar_thresholds, positives_positions

n_guard_cells = 5
n_avg_cells = 5
threshold = 13
ca_cfar_thresholds, positives_positions = RP_ca_cfar(RX_dB, n_guard_cells, n_avg_cells, threshold)

plt.figure(figsize=(12,20))

plt.subplot(511)
plt.plot(t,chirp)
plt.title(f"Chirp")
plt.legend()

plt.subplot(512)
plt.plot(MF)
plt.axhline(-13, color="orange", label="-13 dB")
plt.title(f"Chirp matched filter")
plt.legend()

plt.subplot(513)
plt.plot(RX)
plt.title(f"Range profile, target with perfect reproduction of chirp in noise")
plt.legend()

plt.subplot(514)
plt.plot(RX_dB)
plt.title(f"Range profile (dB), target with perfect reproduction of chirp in noise")
plt.legend()

plt.subplot(515)
plt.plot(RX_dB, label="range profile (dB)")
plt.plot(ca_cfar_thresholds, label="adaptive threshold (dB)")
plt.vlines(positives_positions, ymin=-100, ymax=1, color="black", alpha=0.2, label="positive range bins")
plt.title(f"target detected at: {positives_positions}")
plt.legend()

range profile CA CFAR with perfect chirp reflection

One can see that I currently have a target reflection coefficient of 1 for a signal of amplitude 1, and a gaussian noise of variance of 0.01, leading to a SNR of $20*log_{10}(1/0.01)=40$ dB. I've read a couple of references linking a pre-requisite $P_{fa}$ to the CA CFAR parameters without getting really convinced what to use for my naive range profile simulation.

Among the confusing elements in my implementation:

  • range cells correspond to the sampling frequency fs, which is substantially higher than the chirp bandwidth B (and not a multiple of the latter I might add), which in turn means the range bin 1/fs is much smaller than the chirp range resolution 1/B.
  • noise is added range cell-wise, and not "directly" on the sampled signal, but I don't think this changes anything here

This SE site has numerous CA CFAR questions (Q1, Q2, Q3) but the answers don't help much unfortunately.

$\endgroup$
6
  • $\begingroup$ Why are you concerned that the range cell size is smaller (finer) than the waveform bandwidth? This is usually desired. $\endgroup$
    – Envidia
    Commented Nov 21 at 15:51
  • $\begingroup$ @Envidia it seems intuitive to me that to "detect at the range resolution scale", one needs to implement CFAR cells at the same ("chirp-relevant") "range resolution scale". Said differently: the scale that actually matters is the range resolution one, and not the ranges slices arbitrarily imposed by the receiver's sampling. Trying a last one: with arbitrarily high range sampling, I could have a large amount of range cells within one "unit" of range resolution, or the opposite, making the sole number of range cells irrelevant for target detection with a given bandwidth. Not sure I'm clear :/ $\endgroup$
    – Blupon
    Commented Nov 21 at 16:00
  • $\begingroup$ I get what you're saying, and you're tricking yourself into this. The fact that you have more cells due to the higher sampling rate is a good thing. This means that you will more properly sample the returns and avoid scalloping losses and have a more accurate peak and delay. The only "problem" this really introduces is that you need a little more processing power to go through all the cells. The waveform's range resolution does not limit you in your case. $\endgroup$
    – Envidia
    Commented Nov 22 at 17:04
  • $\begingroup$ Thanks for getting back to this question. Are you suggesting that, whatever the chirp bandwidth and whatever the (reasonably) unconstrained range cell sampling, I can arbitrarily pick Pfa + number of reference cells to set my threshold ? If you're positive about that, feel free to elaborate this a bit in an answer I'll accept :-) $\endgroup$
    – Blupon
    Commented Nov 23 at 23:52
  • $\begingroup$ Sure, once I get some time I'll be happy to provide an answer. Also, the number of reference or training cells is not arbitrary in the general sense. The point is that the higher sample rate tends to help you. $\endgroup$
    – Envidia
    Commented Nov 24 at 3:20

1 Answer 1

1
$\begingroup$

As the name implies, the constant false alarm rate (CFAR) detector performs detection based on a probability of false alarm $P_{fa}$, which you specify. The cell-averaging CFAR, which is very common, averages cells both lagging and leading the cell under test (CUT) to get an estimate of the noise. Since there might be multiple peaks in the matched-filter signal, the noise estimate may become biased as the training cells may sample some of the other peaks. This is where the guard cells come into play. These cells are ignored in an attempt to avoid sampling other peaks or part of the peak itself that is currently under consideration.

There are many ways to establish the threshold, both analytical and empirical approaches, the latter coming after analyzing your specific signal environment, waveform, etc. For a simple CA-CFAR working on power samples, the adaptive threshold $T$ is given by

$$T = \alpha P_n$$ $$\alpha = N(P_{fa}^{-1/N}-1)$$

Where $N$ is the number of total training cells and $P_n$ is the average of the training cell samples. Once you specify $P_{fa}$ and $N$, the threshold $T$ will be updated as you slide the training-guard window over all of the CUTs. The major trade-off here is that if you want a low $P_{fa}$, the thresholds will be higher, also reducing the probability of detection $P_d$. The opposite is also true: if you want a higher $P_d$ you must also allow more false alarms.

Your choice of $N$ and the number of guard cells $G$ could be chosen arbitrarily but a smarter approach would be to use the information of your waveform, like its range resolution to establish these values.

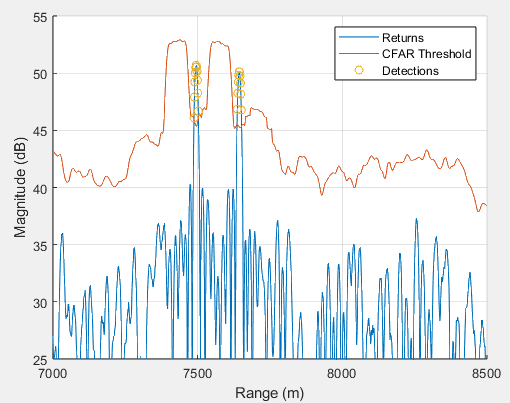
Lets assume an LFM pulse with a sweep bandwidth $\beta = 10 \ \text{MHz}$ sampled at $f_s = 100 \ \text{MHz}$. Also we set the CFAR detector parameters:

$$P_{fa}= 0.001$$ $$N = 50, G = 20$$

Two returns are modeled after pulse-compression:

enter image description here

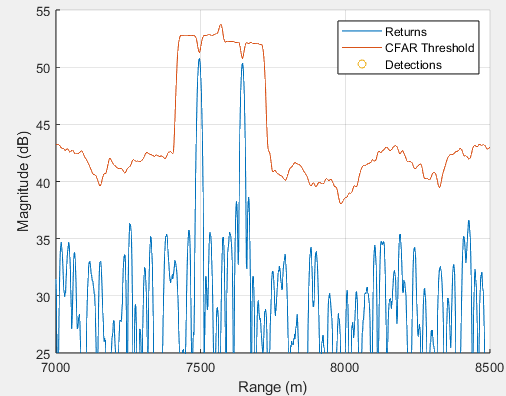
Note the increased thresholds to the left of both peaks. This happens because as we are in that region testing cells, part of the training cells sample the peaks, biasing the noise estimate. Once the peak samples start being the cells under test, the threshold decreases since we have guard cells to avoid biasing again. If we were to have less guard cells, let's say $G=2$:

enter image description here

Since we have less guard cells, portions of the peak bias the threshold to be high, and we miss detections. You can use the range resolution of your waveform to know how wide the return peaks will be, which should guide you on how to pick the number of guard cells. When it comes to the training cells, more will give you a better noise estimate, but you also don't want such a wide window that you sample other peaks and bias the estimate. As you might imagine, there is a lot of tuning done to CFAR detectors as part of a design. There are also variations, where you can dynamically change any of the parameters, but this is more advanced stuff.

The cell size is set by $f_s$, and once a sample is declared a detection you can convert that to a range given the delay. The fact that $f_s$ is larger than $\beta$ is desired, since we get to better sample the signals. We both avoid scalloping losses and get the smoother response as part of the peak. Sure, you have more samples to process but this is a small price to pay to get consistent and improved performance.

Speaking of performance, you can use noise only as the return signals, and calculate how many detections (which are false alarms) were made out of the total possible to get an estimate of $P_{fa}$. You can do something similar for $P_d$, but keep in mind that its parameterized by the SNR.

Mathworks has some good references on CFAR and receiver operating characteristics/curve (ROC) which is commonly used to model and measure performance of the detector.

$\endgroup$
3
  • $\begingroup$ Thanks a lot for this detailed and clear answer. You say N and the number of guard cells G could be chosen arbitrarily (...), so you confirm the threshold computation formula remains valid whatever my (fs, B, # guard cells) set, i.e. whether I take into account the mainlobe size in fs range cells or not ? And to set the dB comparison rule from the power threshold, one would only need to compute $20*log_{10}(\alpha P_n) = 20*log_{10}(\alpha \sum^N_n \frac{x_n}{N})$, where $x_n$ are already "power/signal squared" since they stem from matched filtering, i.e. a scalar product ? $\endgroup$
    – Blupon
    Commented Nov 27 at 9:29
  • 1
    $\begingroup$ @Blupon That's correct, the formula itself is valid regardless of what those parameters are. However depending on the performance you want to achieve depends a lot on your system design and signal environment, where the parameters now need to be chosen more carefully. For the second point, we're going to fall into a discussion about units of correlation functions. You can look around the site for this, but for now just now that the output of the matched filter is still linear scale, so you must square the output to yield power, and then sum. $\endgroup$
    – Envidia
    Commented Nov 27 at 15:06
  • $\begingroup$ Right, thanks a lot, answer accepted :) $\endgroup$
    – Blupon
    Commented Nov 27 at 23:03

Your Answer

By clicking “Post Your Answer”, you agree to our terms of service and acknowledge you have read our privacy policy.

Not the answer you're looking for? Browse other questions tagged or ask your own question.