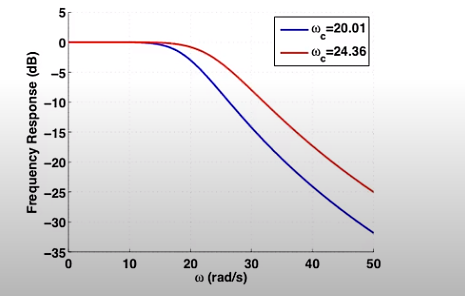
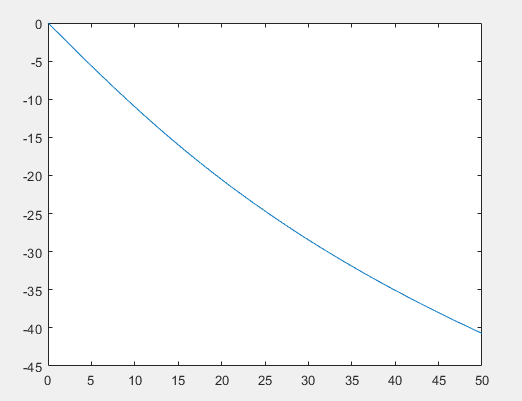
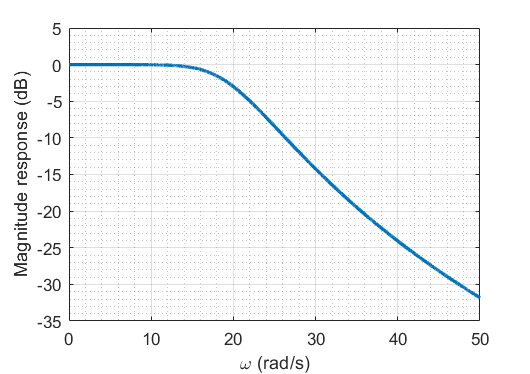
There is a manual which presents a filter response. In the video they present a formula and a plot of the response. However when I tried to implement it in MATLAB I get a totally different plot. Where did I go wrong implementing this formula? Thanks.
clc
clear all
s=0:0.01:50;
H=1./((s/20.01).^4+2.6131*(s/20.01).^3+3.4142*(s/20.01).^2+2.6131*(s/20.01)+1);
plot(s,20*log10(abs(H)))
https://www.youtube.com/watch?v=3yyp5JRqNXs&list=PLdciPPorsHunK-nh9PyXcA8rTy4m-TuOV&index=4


