0
$\begingroup$

I know this may be a kind of basic question, but I have my head wrapped over it for some time and hadn't found a solution. I want to generate the frequency response of a 4th order butterworth filter programatically for a given sampling rate and cutoff frequency. I've used the matlab filter response and my filter code response to compare. In my code i've used:

$$ H(j\omega )=\frac{1}{(1-3.4142136\hspace{1.2mm}\omega^{2}+\omega^{4})+j2.613126(\omega - \omega^{3})} $$

And got a close comparison between the two. What am I missing to make my code response like the matlab one? adjust the even function symmetry on the magnitude and odd function symmetry on angle at nyquist frequency and rolloff of both using the H(jw) programatically.

Here is my matlab code and results

clear all;
clc;
n = 4;
fs = 100;
t = 1:1:100;
lo = 35;
in = ones(1,length(t));
in = ifft(in);
[b,a] = butter(n,lo/(fs/2),'low');
outA = filter(b,a,in);
outB = ones(1,length(t));
for x = 1:length(t)
    wl = x/lo;
    outB(x) = (1/((1-3.4142136*(wl^2)+(wl^4))+(2.613126*(wl - wl^3))*1i));
end
fourierabsA = abs(fft(outA));
fourierabsB = abs(outB);
fourierangA = angle(fft(outA));
fourierangB = angle(outB);
subplot(2,2,1);
stem(t,fourierabsA);
title('Matlab Filter Magnitude')
subplot(2,2,2);
stem(t,fourierabsB);
title('My Filter Magnitude')
subplot(2,2,3);
stem(t,fourierangA);
title('Matlab Filter Angle')
subplot(2,2,4);
stem(t,fourierangB);
title('My Filter Angle')

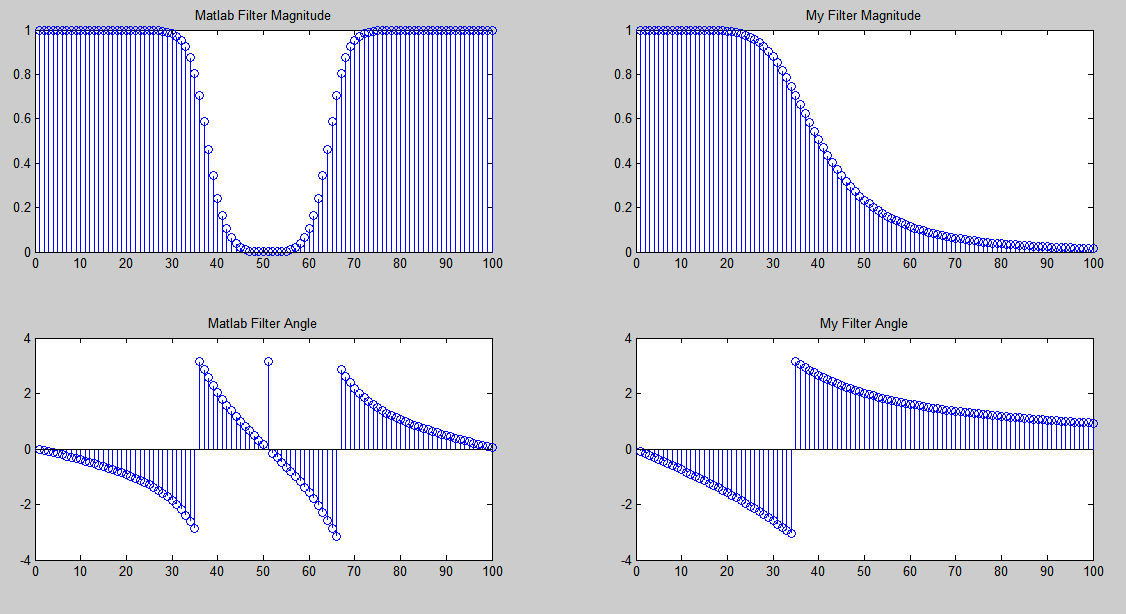
responses

$\endgroup$
4
  • $\begingroup$ I'm sorry, I don't know if I deleted your response by accident. Answering your questions, it's the frequency respose of 4th order butterworth filter H(s) = 1/1+2.6s+3.4s²+2.6s³+s^4 . I use x to iterate because it has a 100hz sample frequency with 100 samples, so it's ok to iterate one by one. In lowpass filter I substitute w with current w divided by cutoff w $\endgroup$ Commented Jun 18, 2018 at 2:38
  • $\begingroup$ You're using the continuous time formula for the Butterworth (a function of the Laplace operator, s), but you're designing it in digital domain. You should add an 's' to your [b,a] design. See help butter. $\endgroup$ Commented Jun 18, 2018 at 5:47
  • $\begingroup$ The [b,a] design is the correct part. I want the right side graphs to be like the left ones. I think I'll have to use bilinear transform or something like that? $\endgroup$ Commented Jun 18, 2018 at 10:41
  • $\begingroup$ So is the analog part, but, yes, you guessed it, either you bring the analog to the digital, or vice-versa. The bilinear transform is the usual "culprit" for this job, but since this is a lowpass, impulse invariance is also god enough, though you may want to stick to BLT, since, if I'm not mistaken, that's how butter works, internally. $\endgroup$ Commented Jun 18, 2018 at 14:52

1 Answer 1

1
$\begingroup$

Matlab's fft function returns the two-sided spectrum. To get your graphs to agree, start by only looking at the first half of the spectrum.

% note *2 to double the length
in = ones(1,length(t)*2);
in = ifft(in);
[b,a] = butter(n,lo/(fs/2),'low');
outA = filter(b,a,in);
fftA = fft(outA);

% snip out the first half
fftA = fftA(1:length(fftA)/2);

fourierabsA = abs(fftA);
fourierangA = angle(fftA);
$\endgroup$
1
  • $\begingroup$ Yes, that is kind of what I want. If I can get the first half to be right on my filter, I'll be able to replace the second half with the mirrorred abs and negative mirrorred angle (even and odd functions) $\endgroup$ Commented Jun 20, 2018 at 20:48

Your Answer

By clicking “Post Your Answer”, you agree to our terms of service and acknowledge you have read our privacy policy.

Not the answer you're looking for? Browse other questions tagged or ask your own question.