1
$\begingroup$

I have two sensor data in time series as an array, when I plot we have this image. The peak you see in sensor 1 is something I am interested in classifying, It is easy to see that there is a similarity in both waves i.e when a heart beats the sensor 1 goes two peaks (up and down) and immediately after some gap sensor 2 shows two down peaks. How do i show this in a algorithm? I discretized this data and tried the ml algos like decision tree, random forest , mlp , svm but it did not work.enter image description here
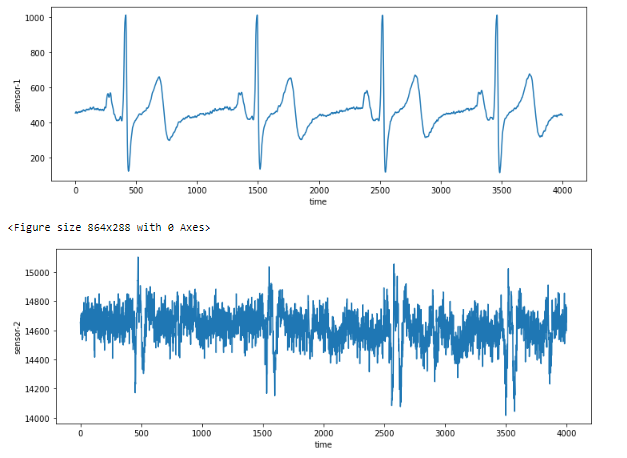
Goal: To have two clusters (No heart beat and heart beat) for any given instant.

$\endgroup$

1 Answer 1

0
$\begingroup$

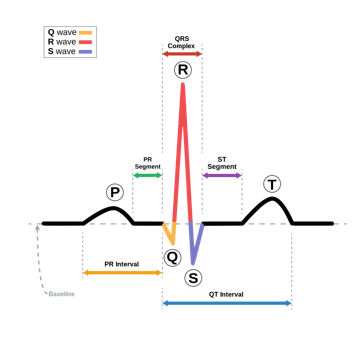
The goal would be to detect the QRS Complex in an ECG or EKG pattern as depicted in the graphic below created by Anthony Atkielski and detailed here.

ECG

Matlab has a real-time ECG QRS Detection model based on this paper:

J. Pan and W. Tompkins, A Real-Time QRS Detection Algorithm, IEEE Transactions on Biomedical Engineering, 32(3): 230-236, March 1985

The algorithm consists of filtering the signal with a passband filter and then taking the derivative and absolute value of the result. That result is then processed with a moving window averager determined empirically to be 150 ms. The rising edge out of the moving window averager corresponds to the width of the QRS complex, and the temporal location of the QRS complex can be determined from this rising edge depending on specific feature (such as maximum slope etc).

The adaptive threshold detector uses two thresholds to classify samples as either signal peaks or noise peaks, keeps a running average and adaptively adjusts the thresholds based on these averages to optimize probability of false alarm and probability of detection.

$\endgroup$

Your Answer

By clicking “Post Your Answer”, you agree to our terms of service and acknowledge you have read our privacy policy.

Not the answer you're looking for? Browse other questions tagged or ask your own question.