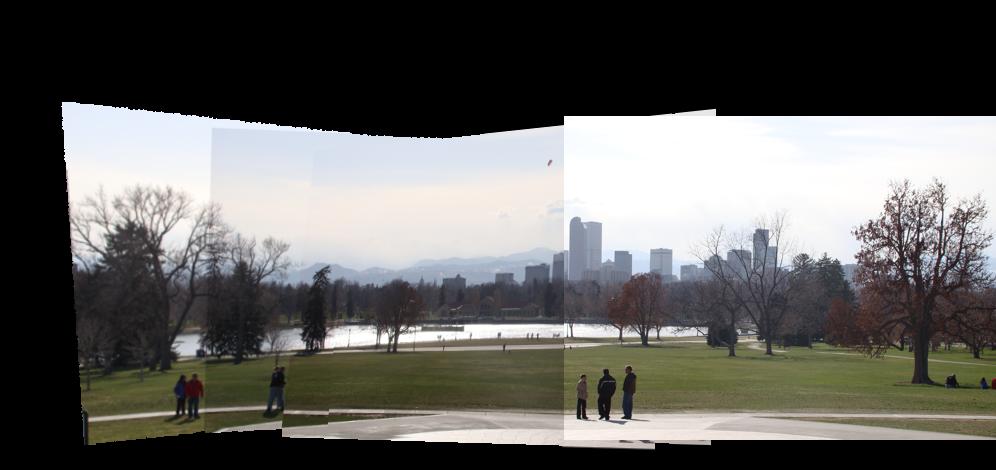
This solution has 2 parts :
- Outer Perimeter
- Inner Perimeter
MATLAB script available by email on request to any of these : [email protected] [email protected]
1.- OUTER PERIMETER
close all;clear all;clc

A1=imread('test_image_6432578.jpg');
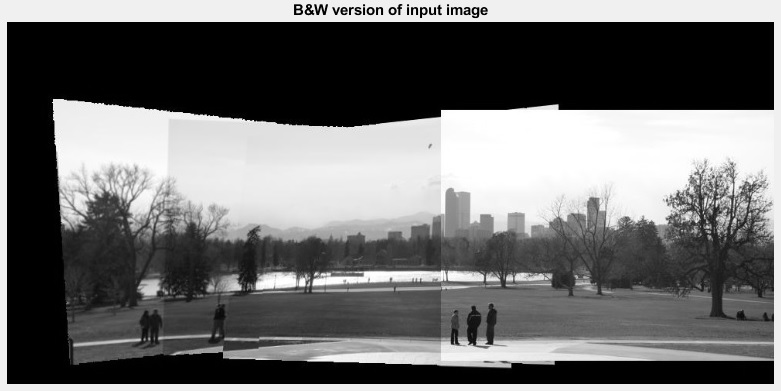
A2=rgb2gray(A1);

figure(1)
ax1=gca
imshow(A2);
hold(ax1,'on')
% 101
1.1.- Top-to-Bottom probing
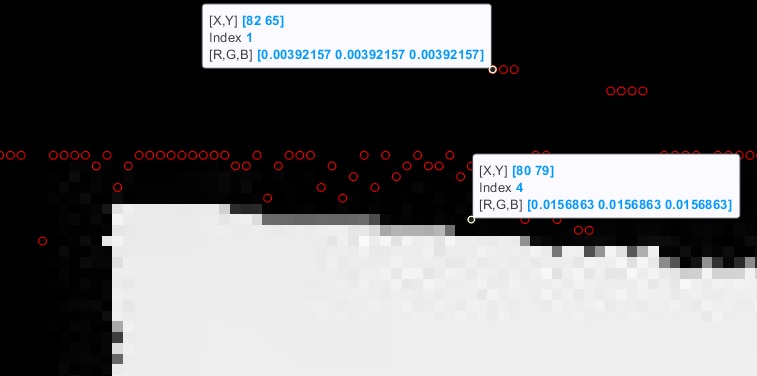
Using a colour range instead of single value threshold to avoid probe stopping at pixels with values near 0 but not exactly null.
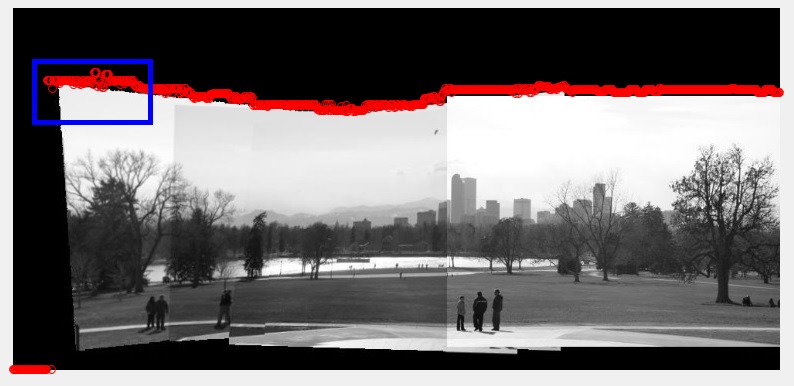
this is what happens with scalar thresholds
[sz2,sz1]=size(A2) % measure size image, sz1: X axis, sz2: Y axis

thpx1=[0:5]; % frame colour range to remove
n1=1 % line pixel index
pb1=0 % probe index
log_pb1=[];
for k=1:1:sz1
    px1=A2(1,k);
    if sum(px1==thpx1)>0
        pb1=1;
        while sum(px1==thpx1)>0 && pb1<sz2
            pb1=pb1+1;
            px1=A2(pb1,k);
        end
    end
    log_pb1=[log_pb1 pb1];
    pb1=0;
end
plot([1:sz1],log_pb1,'ro')
n1_out=min(log_pb1)
plot(ax1,[1 sz1],[n1_out n1_out],'b','LineWidth',3)
1.2.- Left-to-Right probing
thpx2=[0:5]; % frame colour range to remove
n2=1 % line pixel index
pb2=0 % probe index
log_pb2=[];
for k=1:1:sz2
    px2=A2(k,1);
    if sum(px2==thpx2)>0
        pb2=1;
        while sum(px2==thpx2)>0 && pb2<sz1
            pb2=pb2+1;
            px2=A2(k,pb2);
        end
    end
    log_pb2=[log_pb2 pb2];
    pb2=0;
end
plot(log_pb2,[1:sz2],'ro')
n2_out=min(log_pb2)
plot(ax1,[n2_out n2_out],[1 sz2],'b','LineWidth',3)
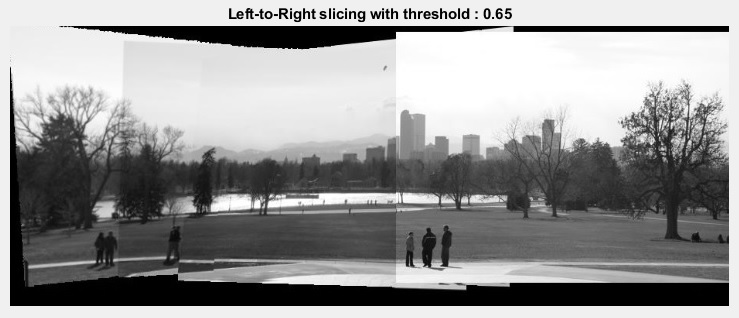
1.3.- Bottom-to-Top probing
thpx3=[0:5]; % frame colour range to remove
n3=1 % line pixel index
pb3=0 % probe index
log_pb3=[];
for k=1:1:sz1
    px3=A2(1,k);
    if sum(px3==thpx3)>0
        pb3=sz2;
        while sum(px3==thpx3)>0 && pb3>1
            pb3=pb3-1;
            px3=A2(pb3,k);
        end
    end
    log_pb3=[log_pb3 pb3];
    pb3=0;
end
plot(ax1,[1:sz1],log_pb3,'ro')
n3_out=max(log_pb3)
plot(ax1,[1 sz1],[n3_out n3_out],'b','LineWidth',3)
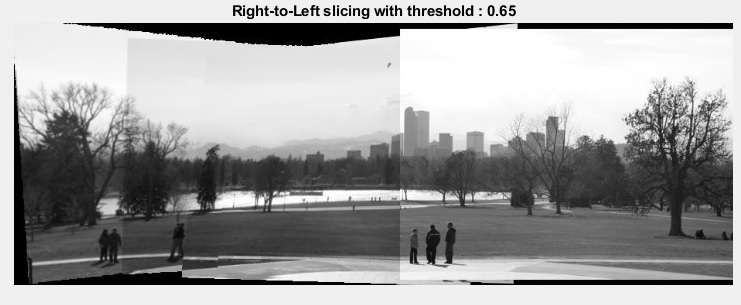
1.4.- Right-to-Left probing
thpx4=[0:5]; % frame colour range to remove
n4=1 % line pixel index
pb4=0 % probe index
log_pb4=[];
for k=1:1:sz2
    px4=A2(k,1);
    if sum(px4==thpx4)>0
        pb4=sz1;
        while sum(px4==thpx4)>0 && pb4>1
            pb4=pb4-1;
            px4=A2(k,pb4);
        end
    end
    log_pb4=[log_pb4 pb4];
    pb4=0;
end
plot(ax1,log_pb4,[1:sz2],'ro')
n4_out=max(log_pb4)
plot(ax1,[n4_out n4_out],[1 sz2],'b','LineWidth',3)
Same outcome because there are no frame pixels on the right hand side of the picture.
Example how to use patch to draw perimeter:
hp1=patch(ax1,[n2_out n4_out n4_out n2_out],[n3_out n3_out  n1_out n1_out],[1 1 1]);
hp1.EdgeColor=[0 1 0]
hp1.FaceAlpha=0 % inside transparency
hp1.EdgeAlpha=1  % edge transparency
hp1.LineWidth=2
hp1.LineJoin='round'
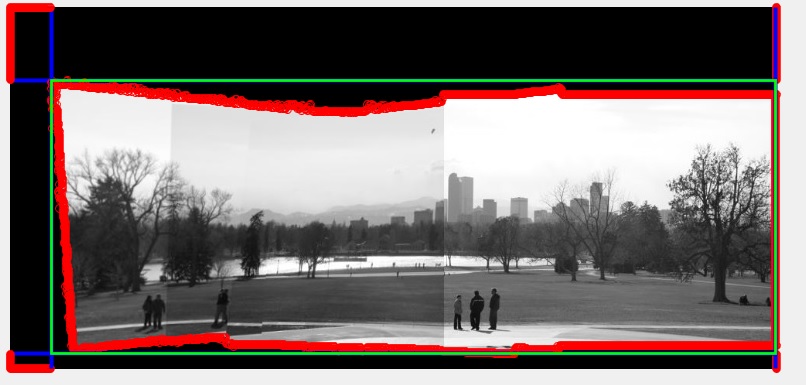
1.5.- Trim Outer Box
A3=A1; % keep copy

% outer box trim gray scale reference image
if n1_out>0 A2([1:n1_out],:)=[]; end % Top-to-Bottom
if n2_out>0 A2(:,[1:n2_out])=[]; end % Left-to-Right
if n3_out>0 A2([end-(sz2-n3_out):end],:)=[]; end % Bottom-to-Top
if n4_out>0 A2(:,[end-(sz1-n4_out):end])=[]; end % Right-to-Left

% outer box trim input colour image
if n1_out>0 A3([1:n1_out],:,:)=[]; end % Top-to-Bottom
if n2_out>0 A3(:,[1:n2_out],:,:)=[]; end % Left-to-Right
if n3_out>0 A3([end-(sz2-n3_out):end],:,:)=[]; end % Bottom-to-Top
if n4_out>0 A3(:,[end-(sz1-n4_out):end],:,:)=[]; end % Right-to-Left

figure(2);
imshow(A3)
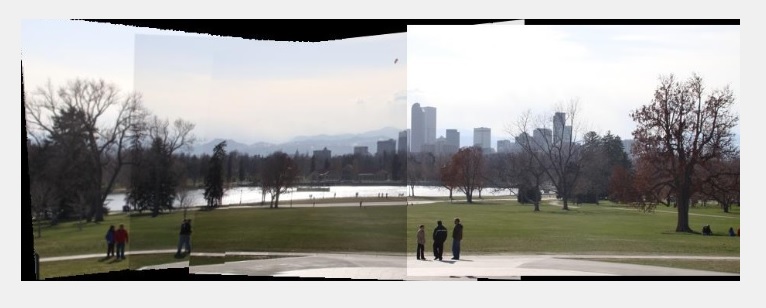
2.- INNER PERIMETER
Now the side-by-side process is repeated but the fining the inner perimeter, that is easier to define starting from the above defined outer perimeter.
figure(3)
ax3=gca
imshow(A2)
hold(ax3,'on')

[sz2,sz1]=size(A2) % measure size image, sz1: X axis, sz2: Y axis
2.1.- Inner Box : Top-to-Bottom
thpx1=[0:5]; % frame colour range to remove
n1=1 % line pixel index
pb1=0 % probe index
log_pb1=[];
for k=1:1:sz1
    px1=A2(1,k);
    if sum(px1==thpx1)>0
        pb1=1;
        while sum(px1==thpx1)>0 && pb1<sz2
            pb1=pb1+1;
            px1=A2(pb1,k);
        end
    end
    log_pb1=[log_pb1 pb1];
    pb1=0;
end
plot(ax3,[1:sz1],log_pb1,'ro')
n1_in=max(log_pb1)
plot(ax3,[1 sz1],[n1_in n1_in],'Color',[0 1 1],'LineWidth',3)
2.2.- Inner Box : Left-to-Right
**thpx2=[0:5]; % frame colour range to remove
n2=1 % line pixel index
pb2=0 % probe index
log_pb2=[];
for k=1:1:sz2
    px2=A2(k,1);
    if sum(px2==thpx2)>0
        pb2=1;
        while sum(px2==thpx2)>0 && pb2<sz1
            pb2=pb2+1;
            px2=A2(k,pb2);
        end
    end
    log_pb2=[log_pb2 pb2];
    pb2=0;
end
plot(ax3,log_pb2,[1:sz2],'ro')
n2_in=max(log_pb2)
plot(ax3,[n2_in n2_in],[1 sz2],'Color',[0 1 1],'LineWidth',3)**
Top-to-Bottom (Inner Box) has been easy, but the Inner Box Left-to-Right shows few outliers that if considered would halve the image :
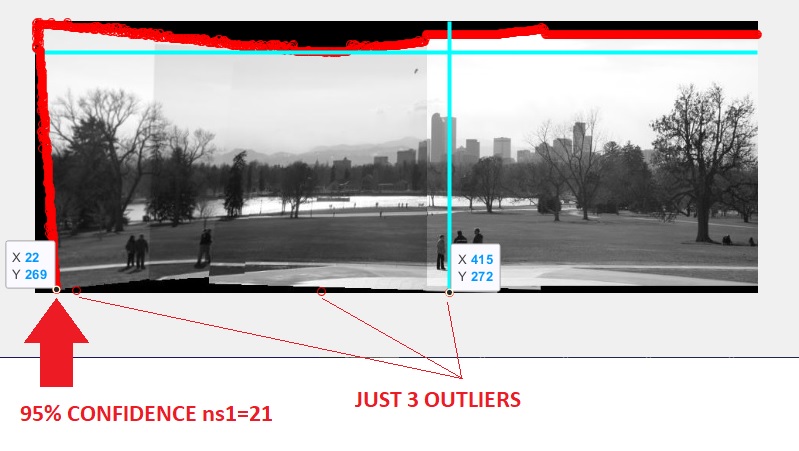
After checking statistics of log_pb1 log_pb2 log_pb3 log_pb3 the variables where the measured offsets are stored,
mean(log_pb2)
var(log_pb2)
figure(4);
hh1=histogram(log_pb2,400);grid on
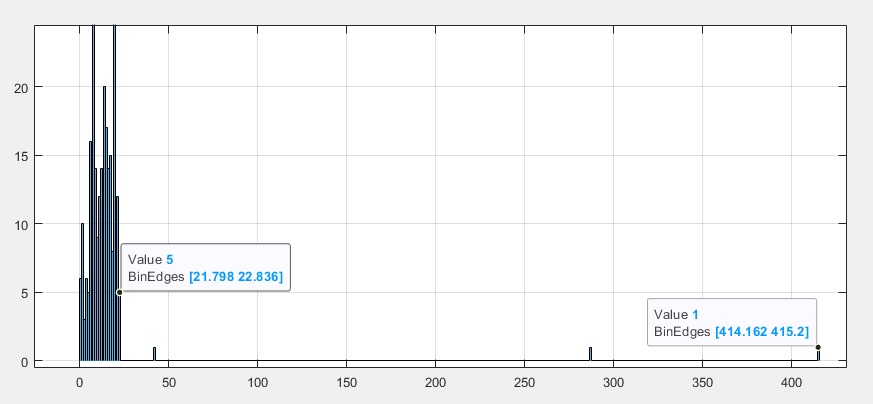
one realises that the misleading outliers are really few and located way way far from the bulk of data that really conforms the sought edges.
To exclude marginally few (really small amount of) outliers one can calculate and apply 95% interval confidence upper and lower limits
The standard in-the-manual procedure is to assume normal distribution
[xc,lags] = xcorr(log_pb2,20,'coeff');
vcrit = sqrt(2)*erfinv(0.95)
Lconf = -vcrit/sqrt(numel(log_pb1))
Uconf = vcrit/sqrt(numel(log_pb1))
Now, should one do [mean-100*Lconf mean+100*Uconf] ? because Lconf and Uconf are really small for any use.
If so is there any other missing scaling factor?
Instead of using a generic normal distribution to calculate the 95% confidence interval it's safer to use the pdf of log_pb2 the all-weather safety rule of just work with the available data.
pdf_log_pb2=hh1.Values/sum(hh1.Values);

s2=0 % integration result
ns2=1 % integration index
s2=sum(pdf_log_pb2([1:ns2]))
while s2<.95
    ns2=ns2+1;
    s2=sum(pdf_log_pb2([1:ns2]));
end
therefore
n2_in=ns2
plot(ax3,[n2_in n2_in],[1 sz2],'Color',[0 1 1],'LineWidth',3)
2.3.- Inner Box : Bottom-to-Top
thpx3=[0:5]; % frame colour range to remove
n3=1 % line pixel index
pb3=0 % probe index
log_pb3=[];
for k=1:1:sz1
    px3=A2(1,k);
    if sum(px3==thpx3)>0
        pb3=sz2;
        while sum(px3==thpx3)>0 && pb3>1
            pb3=pb3-1;
            px3=A2(pb3,k);
        end
    end
    log_pb3=[log_pb3 pb3];
    pb3=0;
end
plot(ax3,[1:sz1],log_pb3,'ro')
n3_in=min(log_pb3)
2.3.1.- again avoid outliers
A few outliers keeping inner box bottom edge outside
mean(log_pb3)
var(log_pb3)
figure(5);
hh2=histogram(log_pb3,sz2);grid on
Worth mentioning for histograms it's important to use the right bin count otherwise data expands, the amount bins must not exceed sz1 sz2 .
pdf_log_pb3=hh2.Values/sum(hh2.Values);

s3=0 % integration result
ns3=1 % integration index
s3=sum(pdf_log_pb3([sz2:-1:sz2-ns3]))
while s3<.95
    ns3=ns3+1;
    s3=sum(pdf_log_pb3([sz2:-1:sz2-ns3]));
end
therefore
n3_in=sz2-ns3
dn3_in=ns3 % relative offset

plot(ax3,[1 sz1],[n3_in n3_in],'Color',[0 1 1],'LineWidth',3)
2.4.- Inner Box : Right-to-Left
thpx4=[0:5]; % frame colour range to remove
n4=1 % line pixel index
pb4=0 % probe index
log_pb4=[];
for k=1:1:sz2
    px4=A2(k,1);
    if sum(px4==thpx4)>0
        pb4=sz1;
        while sum(px4==thpx4)>0 && pb4>1
            pb4=pb4-1;
            px4=A2(k,pb4);
        end
    end
    log_pb4=[log_pb4 pb4];
    pb4=0;
end
plot(ax3,log_pb4,[1:sz2],'ro')
n4_in=max(log_pb4)
plot(ax3,[n4_in n4_in],[1 sz2],'Color',[0 1 1],'LineWidth',3)
patch inner perimeter
hp2=patch(ax3,[n2_in n4_in n4_in n2_in],[n3_in n3_in  n1_in n1_in],[1 1 1]);
hp2.EdgeColor=[0 1 0]
hp2.FaceAlpha=0 % inside transparency
hp2.EdgeAlpha=1  % edge transparency
hp2.LineWidth=10
hp2.LineJoin='round'
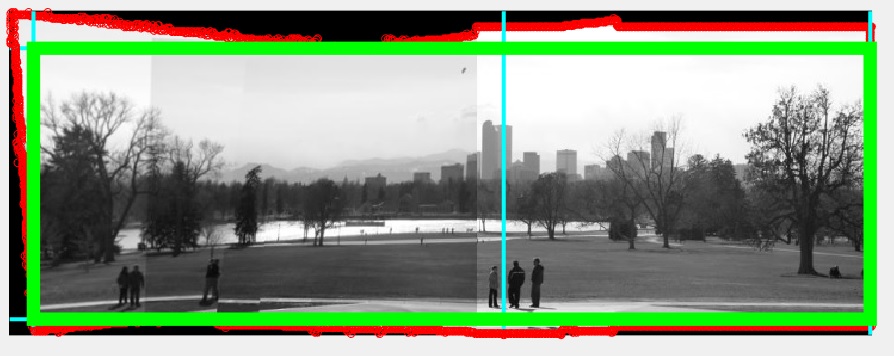
2.5.5.- Trim inner perimeter
if n1>0 A3([1:n1_in],:,:)=[]; end % Top-to-Bottom part I basic trimming
if n2>0 A3(:,[1:n2_in],:)=[]; end % Left-to-Right part I basic trimming
if n3>0 A3([end-dn3_in:end],:,:)=[]; end % Bottom-to-Top part I basic trimming
if n4>0 A3(:,[n4_in:end],:)=[]; end % Right-to-Left part I basic trimming
2.5.6.- Showing resulting image
hf1=figure(6)
imshow(A3)
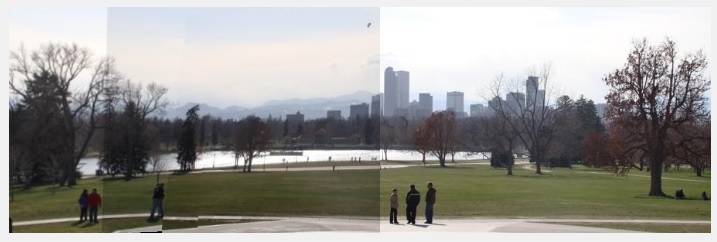
2.5.7.- Saving to JPG File
saveas(hf1,'result_01.jpg')
Thanks for reading my solution.
If you find this solution useful would you please consider clicking on the accepted answer. Many thanks

