Edit: Title
Edit2: Clearer picture of low count rates.
Edit3: Added 2nd sentence for context.
Edit4: Added deconvolution attempt
I've been looking at some scope traces I took of radiation. This is a trace taken from a Geiger Muller (GM) tube. My DSP is really rusty and I can't even remember what to call some of this.
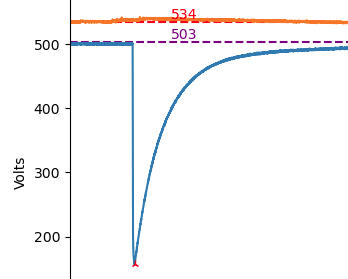
To start off, I've got a signal like the following, at low rates this is fairly simple to find the peak and identify the height. I just take the 503 - the peak.
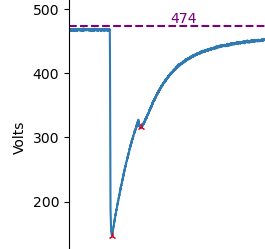
Sometimes events stack up and at first I was content to just use the value of each point relative to the dotted line.
As the pulse rate gets higher this starts to become more of a problem. And my peak detection starts to miss more and more.
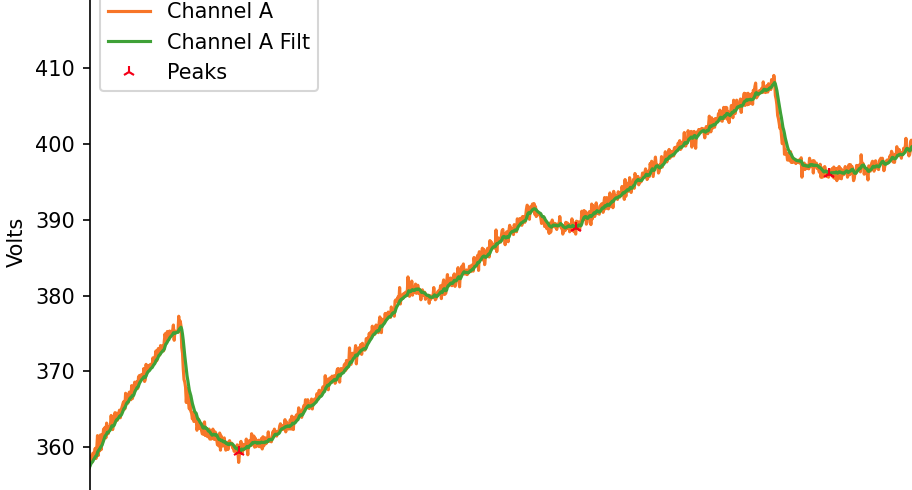
I can do a high pass filter to get rid of some of the noise and that helps a fair amount. However I'm having trouble finding the sweet spot between cleaning the signal, ringing at the peaks, and phase/amplitude shifting the signal. Below is a Butterworth lowpass.
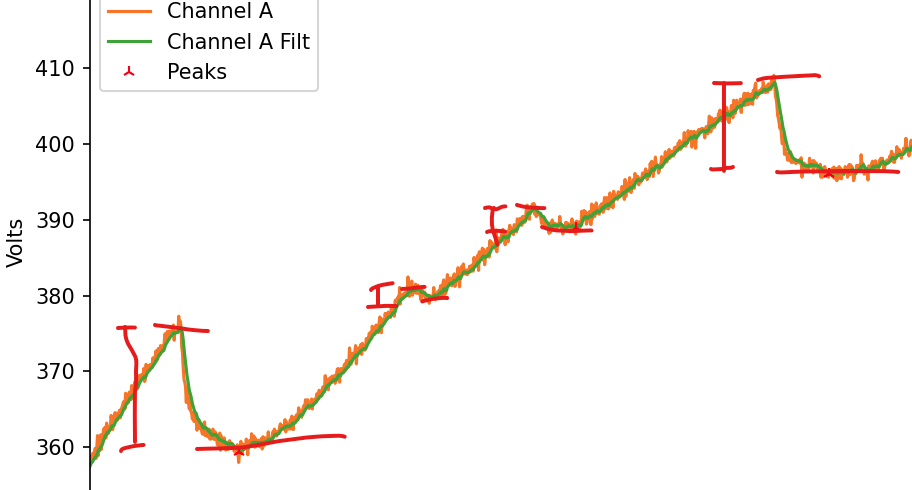
I'd like to also be able to characterize the height based on the distance moved and I'm thinking I can find the high peaks and do some logic to try to make a reasonably accurate estimations.
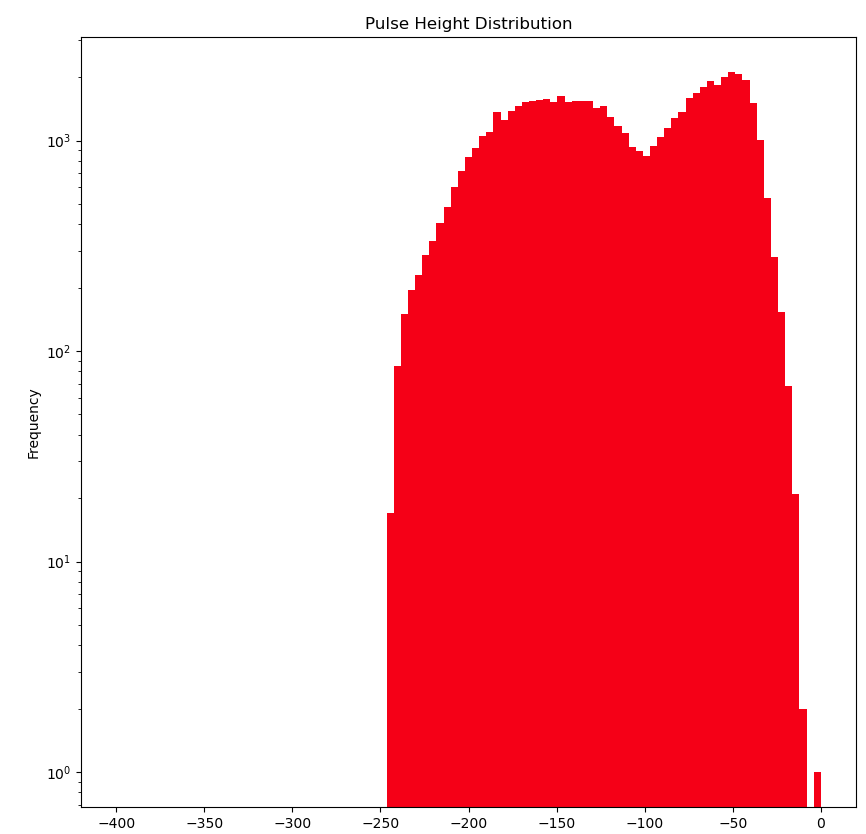
My end goal is to get a histogram of the pulse heights and distances between pulses. The following is an example based on the peak point vs the purple dotted baseline shown in some of the other plots.
But I feel like I'm well into the weeds at this point and my question is this.
Does anyone have any suggestions on how to improve this or a different approach I can take? I have a vague recollection of some FIR (I think its FIR anyway) filters that can "transform" pulses like this but nothing is jumping out at me in my searches.
Thanks for reading if you made it this far.
High level view. Note the "Bananas" level has so many micro pulses its making the large pulses consistently spaced.
Update
Deconvolution Attempt:
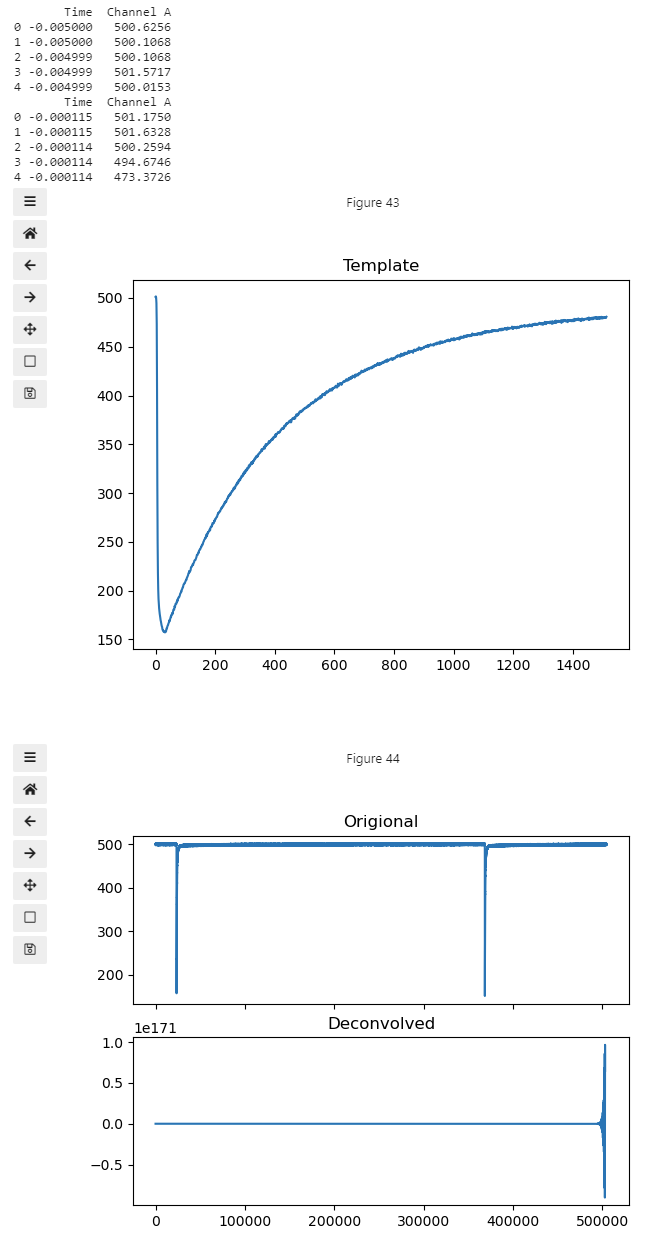
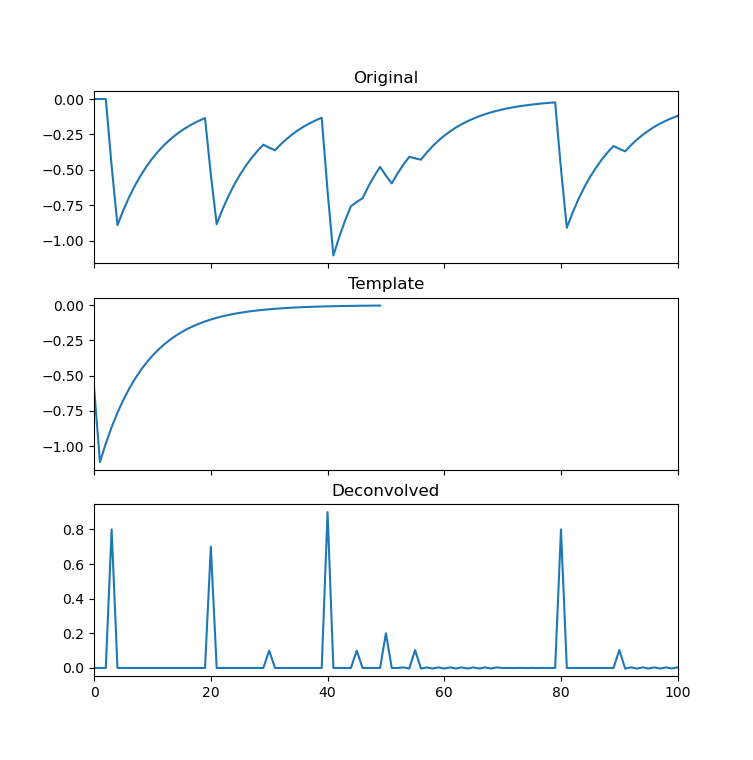
Following one of the suggestions below I tried to find pulses via deconvolution. I say attempt because I'm obviously missing something.
from scipy import signal

single_peak_l_edge = find_nearest_position(raw_dat["Time"], -0.000115)
single_peak_r_edge = find_nearest_position(raw_dat["Time"],  0.0002)
single_peak = raw_dat[single_peak_l_edge:single_peak_r_edge].copy().reset_index(drop=True)

print(raw_dat.head())
print(single_peak.head())

decon, remainder = signal.deconvolve(raw_dat["Channel A"], single_peak["Channel A"])

fig, ax = plt.subplots(1, 1)
ax.plot(single_peak["Channel A"])
ax.set_title("Template")

fig, ax = plt.subplots(2, 1, sharex=True)

ax[0].plot(raw_dat["Channel A"])
ax[0].set_title("Origional")
#ax[0].set_xlim(0, 40e3)

ax[1].plot(decon)
ax[1].set_title("Deconvolved")

