deleted 45 characters in body
Source Link
endolith
  • 16k
  • 8
  • 70
  • 121

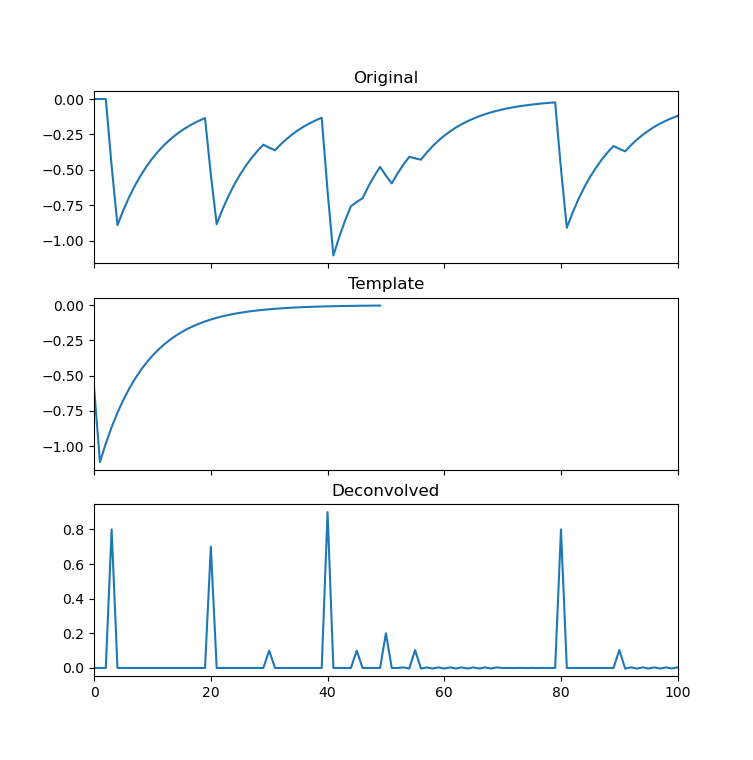
Can you use deconvolution to convert these decaying impulses back into impulses?

Proof of concept:

import numpy as np
from scipy import signal
import matplotlib.pyplot as plt

impulses = np.zeros(200150)
for
times idx= in (10 [3, 30 20, 3330, 40, 45, 50, 110):55, 80, 90]
heights = [-8, -7, impulses[idx]-1, =-9, -1

impulses[100], =-2, -0.31, -8, #-1]
impulses[times] Different= heightheights

b, a = signal.butter(1, 0.104)

filtered = signal.lfilter(b, a, impulses)
 
fig, ax = plt.subplots(3, 1, sharex=True)
ax[0].plot(filtered[:151])
ax[0].set_xlim(0, 100)
ax[0].set_title('Original')

impulse = -signal10*signal.unit_impulse(50)
template = signal.lfilter(b, a, impulse)
ax[1].plot(template)
ax[1].set_title('Template')

deconvolved, remainder = signal.deconvolve(filtered, template)
 
pltax[2].plot(deconvolved)
pltax[2].plotset_title(template'Deconvolved')

Original:

enter image description here

Deconvolution template:

enter image description here

Deconvolved:

enter image description here3 plots of deconvolution example

Then they are separated from each other and you can count their heights and events more easily.

Depends what the properties of the original bumps are, but they look like lowpass filtered impulses, which would mean they are all from convolution with the same impulse response, so this should work?

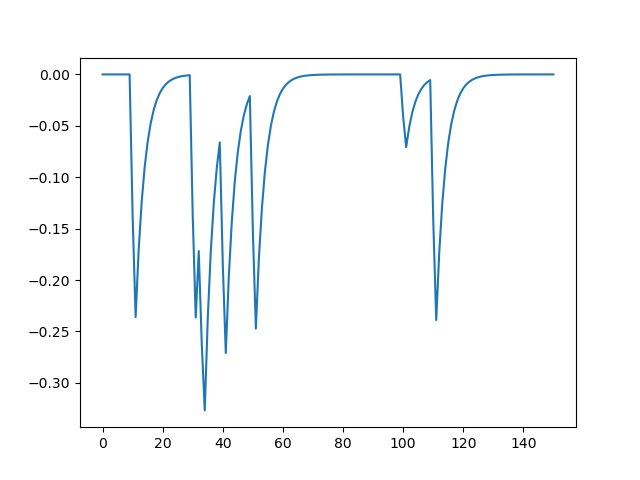
Can you use deconvolution to convert these decaying impulses back into impulses?

Proof of concept:

import numpy as np
from scipy import signal
import matplotlib.pyplot as plt

impulses = np.zeros(200)
for idx in (10, 30, 33, 40, 50, 110):
    impulses[idx] = -1

impulses[100] = -0.3  # Different height

b, a = signal.butter(1, 0.1)

filtered = signal.lfilter(b, a, impulses)
 
plt.plot(filtered[:151])

impulse = -signal.unit_impulse(50)
template = signal.lfilter(b, a, impulse)

deconvolved, remainder = signal.deconvolve(filtered, template)
 
plt.plot(deconvolved)
plt.plot(template)

Original:

enter image description here

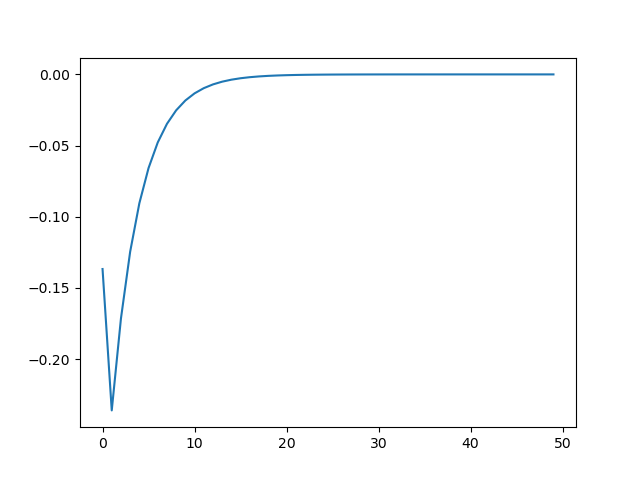
Deconvolution template:

enter image description here

Deconvolved:

enter image description here

Then they are separated from each other and you can count their heights and events more easily.

Depends what the properties of the original bumps are, but they look like lowpass filtered impulses, which would mean they are all from convolution with the same impulse response, so this should work?
Can you use deconvolution to convert these decaying impulses back into impulses?

Proof of concept:

import numpy as np
from scipy import signal
import matplotlib.pyplot as plt

impulses = np.zeros(150)

times =   [3,  20, 30, 40, 45, 50, 55, 80, 90]
heights = [-8, -7, -1, -9, -1, -2, -1, -8, -1]
impulses[times] = heights

b, a = signal.butter(1, 0.04)

filtered = signal.lfilter(b, a, impulses)
fig, ax = plt.subplots(3, 1, sharex=True)
ax[0].plot(filtered[:151])
ax[0].set_xlim(0, 100)
ax[0].set_title('Original')

impulse = -10*signal.unit_impulse(50)
template = signal.lfilter(b, a, impulse)
ax[1].plot(template)
ax[1].set_title('Template')

deconvolved, remainder = signal.deconvolve(filtered, template)
ax[2].plot(deconvolved)
ax[2].set_title('Deconvolved')

3 plots of deconvolution example

Then they are separated from each other and you can count their heights and events more easily.

Depends what the properties of the original bumps are, but they look like lowpass filtered impulses, which would mean they are all from convolution with the same impulse response, so this should work?
Source Link
endolith
  • 16k
  • 8
  • 70
  • 121

Can you use deconvolution to convert these decaying impulses back into impulses?

Proof of concept:

import numpy as np
from scipy import signal
import matplotlib.pyplot as plt

impulses = np.zeros(200)
for idx in (10, 30, 33, 40, 50, 110):
    impulses[idx] = -1

impulses[100] = -0.3  # Different height

b, a = signal.butter(1, 0.1)

filtered = signal.lfilter(b, a, impulses)

plt.plot(filtered[:151])

impulse = -signal.unit_impulse(50)
template = signal.lfilter(b, a, impulse)

deconvolved, remainder = signal.deconvolve(filtered, template)

plt.plot(deconvolved)
plt.plot(template)

Original:

enter image description here

Deconvolution template:

enter image description here

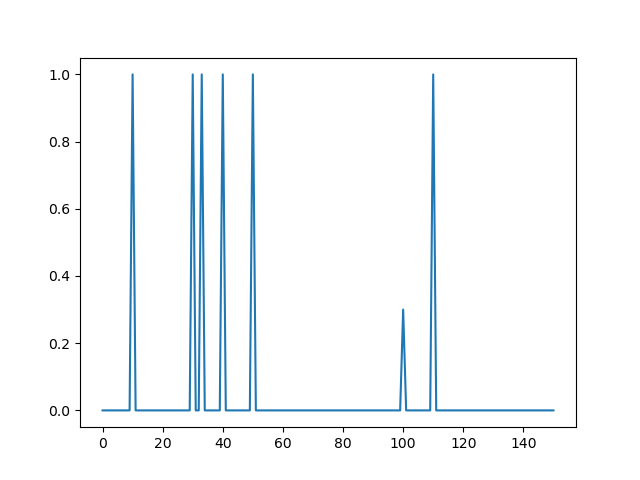
Deconvolved:

enter image description here

Then they are separated from each other and you can count their heights and events more easily.

Depends what the properties of the original bumps are, but they look like lowpass filtered impulses, which would mean they are all from convolution with the same impulse response, so this should work?