2
$\begingroup$

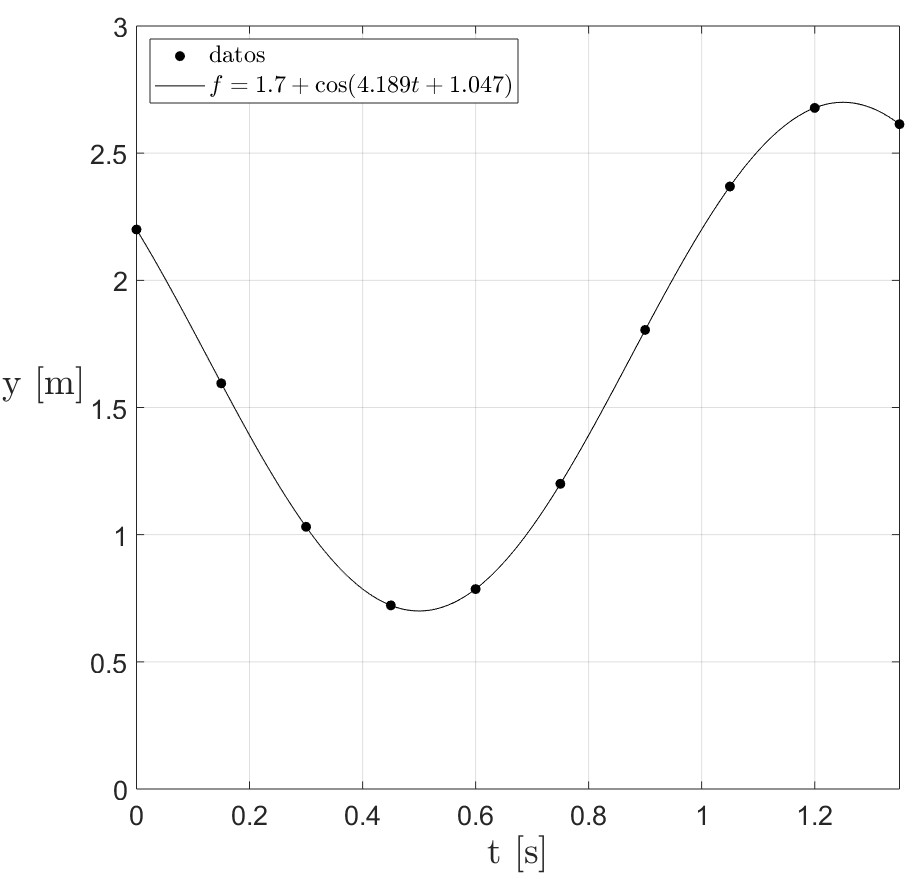
I fitted the function: f(t)=A_o+A_1 cos(wt)+B_1 sin(wt) to the following periodic discrete signal:

t=0:0.15:1.5;

y=[2.200 1.595 1.031 0.722 0.786 1.200 1.805 2.369 2.678 2.614 2.200];

Where w=2*pi / T, and T=1.5 seconds.

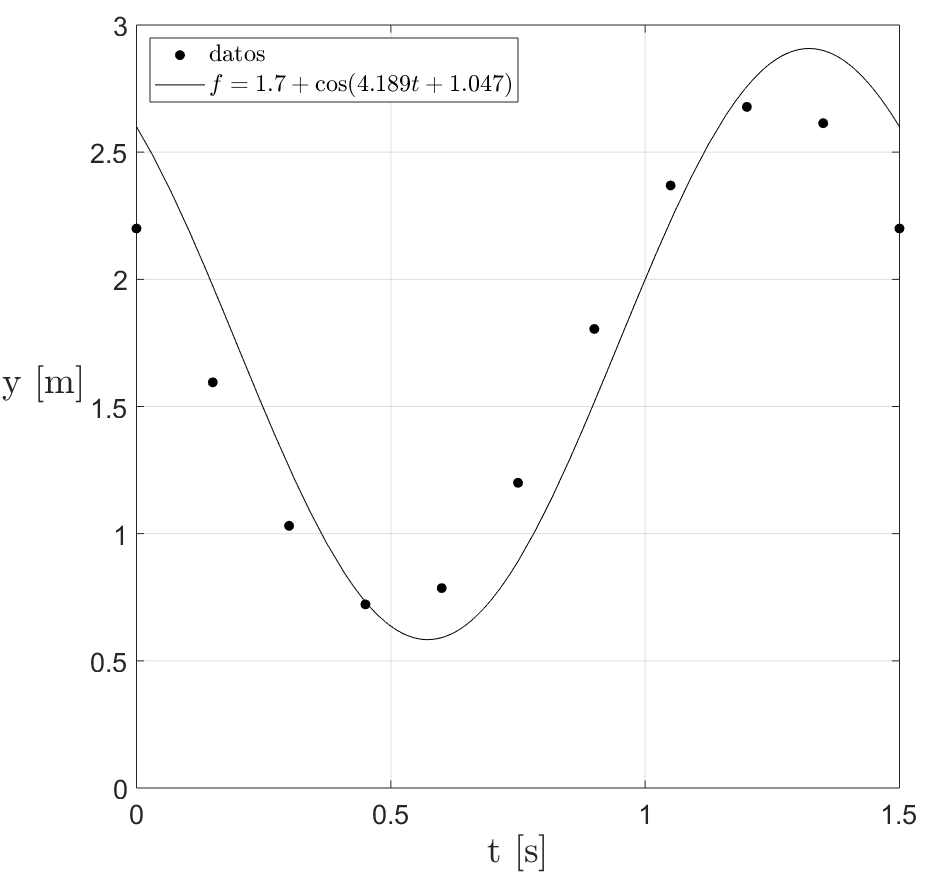
It happens that the fitted curve presents a phase shift with respect to the data. I consulted books on this topic and I found that I should exclude the last point of the series in order to get the right answer,...

Fitted curve N-1 points

Fitted curve N points

I suspect that this matter is related with the exclusion of the last point in the calculation of the DFT, but do not find a mathematical argument that can prove this statement.

I would appreciate any mathematical explanation on this matter.

$\endgroup$

2 Answers 2

1
$\begingroup$

First (wrong) answer (for integrity) The $y$-value of the last point is the same as the first one. As you apparently know the frequency, this point comes in excess of the "fundamental period". It sounds like this additional point comes like an implicit double-weight to the first point of the period.

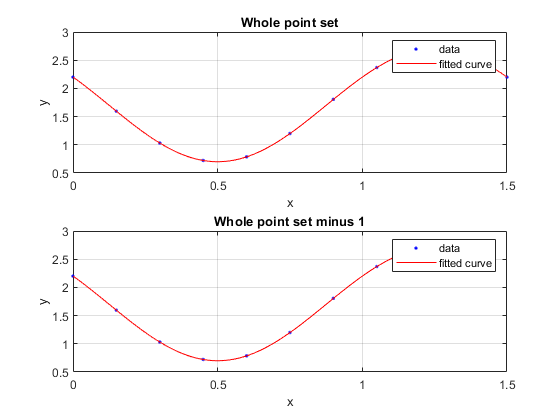
Second take: I have tried to fit the data, with or without the last point. It seems to fit well, both cases.

sine fits

%https://dsp.stackexchange.com/questions/71164/why-should-the-last-point-be-excluded-when-performing-a-least-squares-fit-of-a-d
clear;close all
%% Settings
T = 1.5; w=2*pi / T;
t = (0:0.15:1.5)';
y = [2.200 1.595 1.031 0.722 0.786 1.200 1.805 2.369 2.678 2.614 2.200]';

%% Fitting all points
ft = fittype(@(a1,a2,a3,x) a1+a2*cos(w*x)+a3*sin(w*x),'coefficients',{'a1','a2','a3'},'independent', {'x'});
f = fit( t, y, ft );
% Plot fit
subplot(2,1,1)
plot( f, t, y )
axis([t(1) t(end) 0.5 3])
grid on
title('Whole point set')
%% Fitting all points but the last
ft = fittype(@(a1,a2,a3,x) a1+a2*cos(w*x)+a3*sin(w*x),'coefficients',{'a1','a2','a3'},'independent', {'x'});
f = fit( t(1:end-1), y(1:end-1), ft );
% Plot fit
subplot(2,1,2)
plot( f,  t(1:end-1), y(1:end-1) )
axis([t(1) t(end) 0.5 3])
grid on
title('Whole point set minus 1')
$\endgroup$
2
  • 1
    $\begingroup$ Laurent, I agree with you in this point. Nevertheless, given that in this case the discrete points were generated from an exact equation (see image above), I wonder why this phase shift appears in the fitted curve,... I would expect that the fitted curve passes through all the points, no matter the number of points I consider in the fit. $\endgroup$
    – user53910
    Commented Nov 1, 2020 at 15:47
  • $\begingroup$ You are very right, that was an uneducated guess from my side. I am updating with code $\endgroup$ Commented Nov 1, 2020 at 18:41
1
$\begingroup$

As explained in Laurent's answer, including the last point, which equals the first point, just gives twice as much weight to that point compared to all the others. This doesn't explain a phase shift in your approximation. If you do things right you actually get an almost perfect fit, even with the last point included:

t = 0:0.15:1.5;
y = [2.200 1.595 1.031 0.722 0.786 1.200 1.805 2.369 2.678 2.614 2.200];
t = t(:); y = y(:);
L = length(t);
w0 = 2*pi/1.5;
M = [ones(L,1),cos(w0*t),sin(w0*t)];
x = M\y;        % optimal coefficients
f = M*x;        % approximating function
e = f - y;      % approximation error
   f(t)      y

   2.19999   2.20000
   1.59540   1.59500
   1.03076   1.03100
   0.72175   0.72200
   0.78639   0.78600
   1.20001   1.20000
   1.80460   1.80500
   2.36924   2.36900
   2.67825   2.67800
   2.61361   2.61400
   2.19999   2.20000

If you exclude the last point in the optimization the result is virtually identical. The only difference is the approximation error at the first point, which is slightly smaller when the last point (identical to the first point) is included, because in that case that point gets twice the weight compared to when the last point is not included. The approximation error at the first point $f(t_1)-y_1$ is -5.8462e-06 with the last point included, and -7.6001e-06 with the last point excluded.

$\endgroup$
3
  • $\begingroup$ Matt, I do obtain a phase shift when performing the fit with Matlab,...(see updated question). Please see comment to Laurents answer. $\endgroup$
    – user53910
    Commented Nov 1, 2020 at 15:49
  • 1
    $\begingroup$ @user53910: I believe that you do, but I don't. Look at the numbers in the table. There's no phase shift, and I didn't exclude the last point. So you just have to find the bug in your code. $\endgroup$
    – Matt L.
    Commented Nov 1, 2020 at 16:01
  • $\begingroup$ Indeed, perfect fit $\endgroup$ Commented Nov 1, 2020 at 18:57

Your Answer

By clicking “Post Your Answer”, you agree to our terms of service and acknowledge you have read our privacy policy.

Not the answer you're looking for? Browse other questions tagged or ask your own question.