A good 1d example of this is the foundation of the FFT algorithm in how an $N$ length DFT can be created from two $N/2$ length DFTs. If you look under the hood of this, we are increasing the resolution through multiple copies of a time domain signal each sampled at a different offset, and resulting in each signal containing the low frequency content as well as the aliasing of the high frequencies. The beauty is in the combining such that we can recover the low frequencies by adding the two FFT's and the high frequencies by subtracting the two FFT's (with an appropriate phase adjustment in frequency of one of the two before combining to compensate for the 1 sample shift in the time domain.
Let me demonstrate with formulas and graphics:
Given the general formula for an N length DFT:
$$ X[k] = \sum_{n=0}^{N-1}x[n]W_N^{nk}$$
Where $W_N^{nk}$ are the "roots of unity" phase rotations on a unit circle as $e^{-j2\pi nk/N} $
As further detailed in Cooley and Tukey's famous 1965 paper https://www.ams.org/journals/mcom/1965-19-090/S0025-5718-1965-0178586-1/ the equation above for an $N$ point DFT can be calculated from two $N/2$ point DFT's as:
$$ X[k] = \sum_{r=0}^{N/2-1}x[2r]W_{N/2}^{rk} + W_N^k\sum_{r=0}^{N/2-1}x[2r+1]W_{N/2}^{rk}$$
Here is what you can observe about each of teh two DFT's and how it relates to the OP's question:
Point 1: The first DFT is a DFT of all the even samples in x[n]
Point 2: The second DFT is a DFT of all the odd samples in x[n]
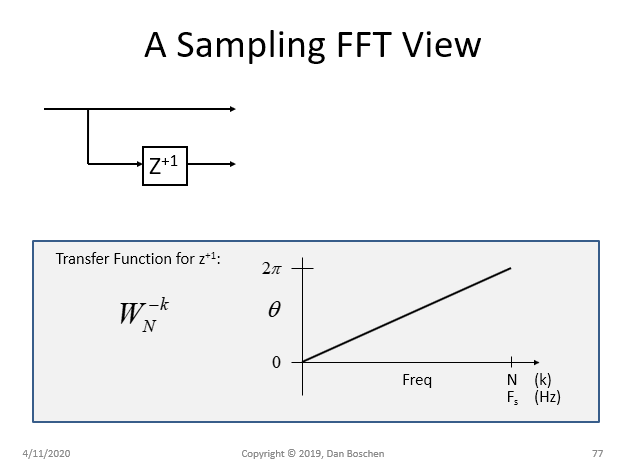
Point 3: The frequency response of $W_N^k$ has a magnitude of 1 for all frequencies and a phase that increases negatively from 0 to $2\pi$ as the frequency goes from 0 to $F_s$ where $F_s$ is the sampling rate (normalized radian frequency of $2\pi$ or normalized frequency in cycles/sample of 1). This is exactly the same as the frequency response of $z^{-1}$, a unit delay of one sample (at the sample rate of x[n])!
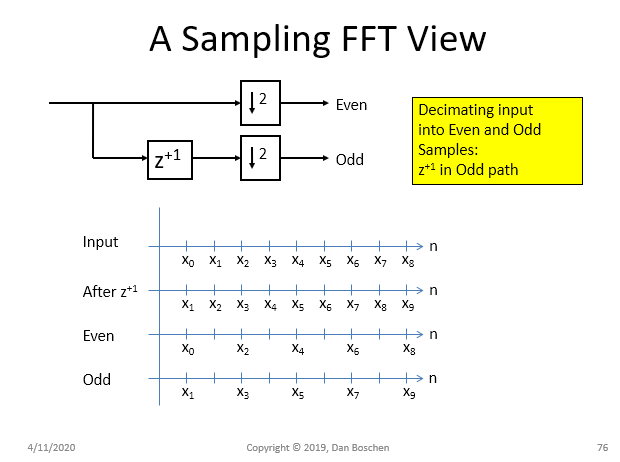
First considering point 1 and 2 if we aligned the resulting even and odd samples in time. What we have done is decimated the sequence by two for the case of the even, and for the case of the odd we have (non-causally) advanced x[n] one sample and repeated the same decimate by two operation.
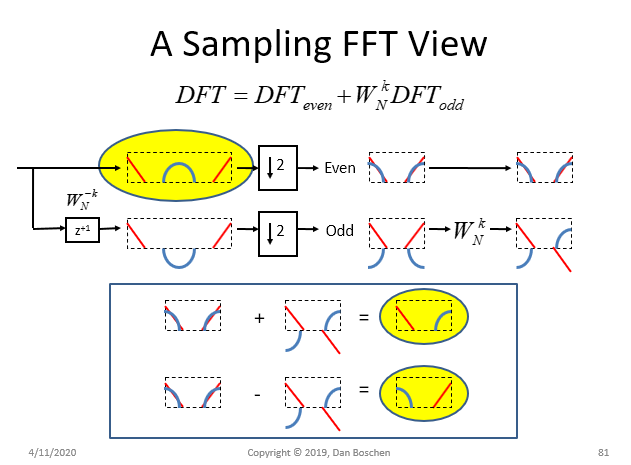
The transfer function of $z^{+1}$ is a magnitude of 1 for all frequencies but notably it advances the phase linearly from $0$ to $2\pi$ as we advance through all frequencies up to the sampling rate.
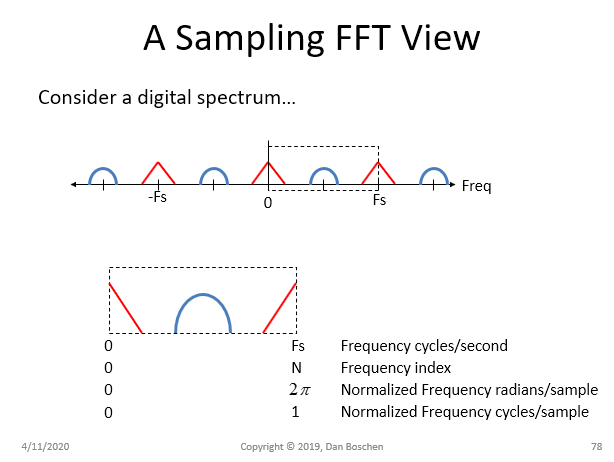
Next consider a digital spectrum so we can see how aliasing is handled in this case. The graphic below depicts a real spectrum where different symbols are used to differential the low frequency from the high frequency components in the first Nyquist zone extending from $0$ to $F_s/2$. The DFT of $N$ samples would return the block extending from $0$ to $F_s$ (with $mF_s$ actually cyclically repeating as bin 0 for all integers $m$).
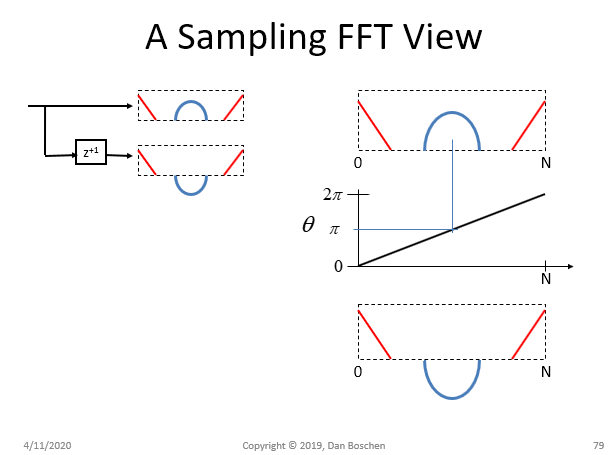
Note what occurs to this spectrum when we compare the spectrum directly to the spectrum after it has gone through the $z^{+1}$ operation (we could equally say the bottom is the direct path and the top one goes through $z^{-1}$ since that could be actually implemented, but this is consistent with us aligning the output of the DFT result with the input without regard to processing delay and then will be consistent with the final formula, so at this point it is just math). The bottom plot doesn't quite show it since I couldn't draw a 3d spiral, but the phase shift is such that at the halfway point it will be $\pi$ or 180° representing a complete inversion of the spectrum such that it will be completely out of phase with the upper one, and then as it extends to the upper end it has spun around 360° so the spectrum at that point is back in perfect phase alignment with the upper one.
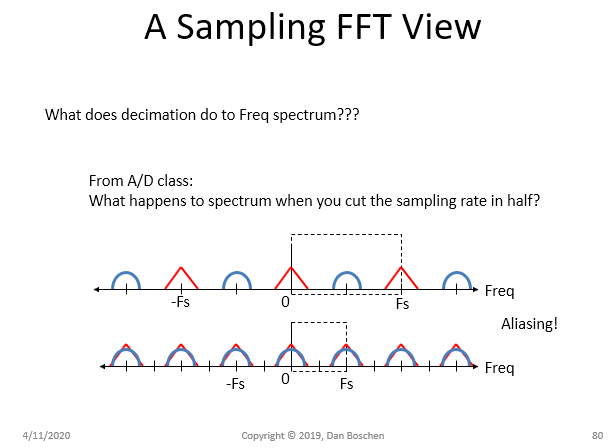
Next we see what happens when we decimate by 2 and how aliasing is created. When we sample any signal, all the spectrum around $mF_s$ for any integer $m$ is mapped via aliasing to $F=0$. So if we resample (which occurs when we select every other sample or decimate by 2), the same thing occurs, we have just created a new sampling rate. Most of the time when we decimate properly we are sure to low pass filter the signal first to eliminate anything in the middle of the spectrum that would alias (so true decimation is low pass filtering and down-sampling; here we are only down-sampling). In our case we want those images as we will be able to separate them with proper recombining:
Below shows the recombining where we recover the low frequency portion by summing the two and the high frequency portion by subtracting. The phase rotator $W_N^k$ is the summation undoes the opposite rotation that was innate in the even/odd FFT processing, and because of the difference in the rotation of the upper spectrum the aliasing can be isolated through adding and subtracting as depicted in the graphics. The subtraction occurs since each DFT here is only $N/2$ long and $W_N^k = -W_N^{k+N/2}$:
So note specific to your question how here was a 1D example of two lower resolution samples of the same data set with an offset in the sampling rate, and with it we are able to create the higher resolution data set (simply by interleaving the even and odd samples of course, but I believe this FFT view helps us see how the aliases are impacted and used to help create the higher frequency components).


