3
$\begingroup$

The target signal is generated by the following analytically solvable hybrid chaotic oscillator

\begin{equation}\label{eq:1} \ddot{u} - 2\beta \dot{u} +(\omega^2+\beta^2)(u-s)=0 \end{equation}

where

  • $\omega$ determines the symbol period as $T = \frac{2\pi}{\omega}$.

  • $\beta \in (0,T^{-1}\ln 2)$ affects the fluctuating amplitude.

  • $s \in{\pm 1}$ is the random bipolar symbol sequence driving the system.

Its typical continuous waveform $u(t)$ for $f=100 \, \mathrm{Hz}$ is as follows:

enter image description here

I am interested in estimating the basis frequency $f$ of the signal. However, the amplitude spectrum of $u(t)$ has no obvious feature that can be used to estimate the frequency. Hence, I calculate

$$z(t) = |u(t)| - 1$$

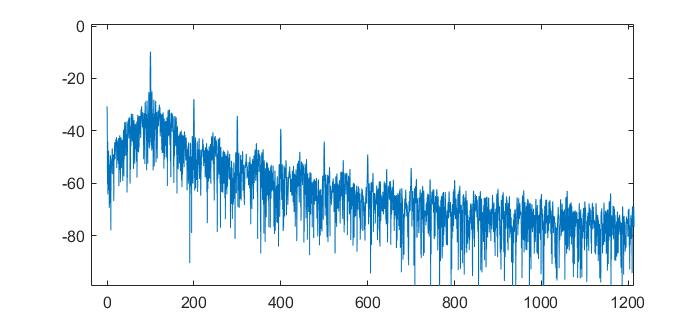
The amplitude spectrum of $z(t)$ is as follows

enter image description here

Obviously, we can see a spike at $f = 100 \, \mathrm{Hz}$. But it is hard to calculate the accurate expression of $z(f)$ since $u(t)$ is a kind of non-stationary signal.

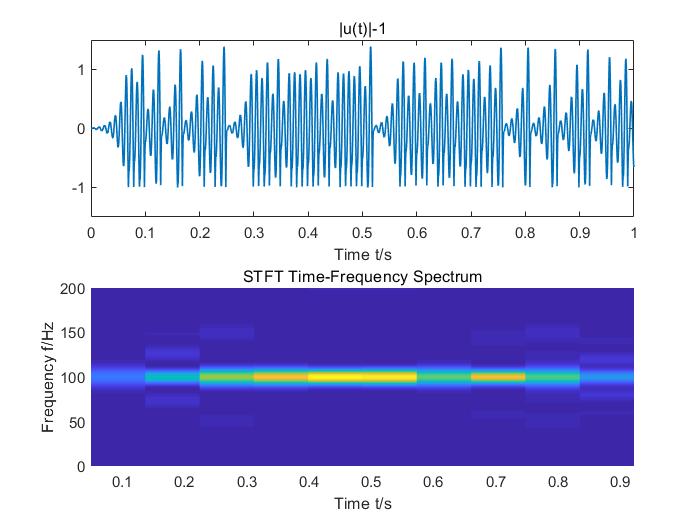
The STFT time-frequency spectrum is shown below

enter image description here

As shown in the STFT results, in some time intervals, no obvious frequency component can be found. However, in the part of approximately periodic waveform, the frequency component at $f = 100 \, \mathrm{Hz}$ is strong.

Is there any theory that can support my method of frequency estimation from the FFT of the whole $z(t)$?


Here is the MATLAB code for generating the chaotic waveform from an analytical expression (not provided above) and my current experiments on frequency estimation.

clear;close all;

finit = 100;%set frequency
% finit =2000;
% finit =2;
om=2*pi*finit;
be=om/(2*pi)*log(2)-0.01*rand(1,1);
T = 2*pi/om; %Period
N=100;% number of symbol
tall = N*T;%total time
h=T*0.01;%time step
t=0:h:tall-h;
ut=zeros(1,length(t));
u_in = 2*rand(1)-1;
% u_in =0.99;
for i=1:N
    if u_in>=0
        s_in = 1;
    else
        s_in = -1;
    end
    t_f = (i-1)*T:h:i*T-h;  %Time of each frame
    n_f = (i-1)*length(t_f)+1:i*length(t_f);
    ut(n_f)=s_in+(u_in-s_in)*exp(be*(t_f+(1-i)*T)).*...
           (cos(om*t_f)-be/om*sin(om*t_f));
    u_in=s_in+(u_in-s_in)*exp(be*T)*cos(om*i*T);
end

figure
plot(t, ut)
xlabel('Time t/s');
title('u(t)')

y = abs(ut) - 1; % Observed signal

%% FFT spectrum
L = length(ut);
Ts_v = t./(0:L-1);
Fs = ceil(1/Ts_v(2));
deltaf= 0.1;
NFFT = floor(Fs/deltaf);
fs = Fs;
f = Fs/2*linspace(0,1,floor(NFFT/2+1));
Y = fft(y,NFFT)/L;
Yabs = 20*log10(abs(Y(1:floor(NFFT/2+1))));
figure;
plot(f,Yabs);
xlim([0,max(f)/4]);
ylim([-100,0]);
xlabel('Frequency f/Hz');
title('FFT Spectrum');
%%  Wavelet Transfrom Time-Frequency spectrum
wavename='cmor3-3';
totalscal=256*2;
Fc=centfrq(wavename); 
c=2*Fc*totalscal;
scals=c./(1:totalscal);
f=scal2frq(scals,wavename,1/fs); 
coefs=cwt(y ,scals,wavename); 


figure;
subplot(211)
plot(t,y,'linewidth',1)
xlim([0 1])
ylim([-1.5 1.5])
subplot(212)
imagesc(t,f,abs(coefs));
set(gca,'YDir','normal')
ylim([0 200]);
% colorbar;
xlabel('Time t/s');
ylabel('Frequency f/Hz');
title('Wavelet Time-Frequency Spectrum');
%% STFT Time-Frequency spectrum
window_len = 10*2*pi/om/h;
noverlap = 50;
nfft = NFFT;
[~,F,T,P]=spectrogram(y,hamming(window_len),noverlap,nfft,fs);


figure;
subplot(211)
plot(t,y,'linewidth',1)
xlabel('Time t/s');
title('|u(t)|-1')
xlim([0 1])
ylim([-1.5 1.5])
subplot(212)
surf(T,F,abs(P),'edgecolor','none')
axis tight;
view(0,90)
ylim([0 200]);
xlabel('Time t/s');
ylabel('Frequency f/Hz');
title('STFT Time-Frequency Spectrum');
```
$\endgroup$
3
  • 1
    $\begingroup$ This looks really interesting. My first inclination would to take the first derivate (technically an approximation thereof), then look at zero crossings. If you want it to show up in a DFT, chop all the peaks off (of the derivative) at a constant height making in essence a square wave. The DFT will then give you clear peaks and the fundamental, the third, the fifth, and a little of the seventh harmonics. I'll double back tomorrow, see what you have done. $\endgroup$ Commented Mar 13, 2019 at 4:06
  • 1
    $\begingroup$ Do you have the code to generate that typical waveform somewhere? I'd like to play around with it a bit! Also, how did you calculate that amplitude spectrum? Gotta be a little careful here, if this process is not weak-sense stationary, then the Wiener-Khinchin Theorem's requirements are not fulfilled, and you need to calculate the PSD as Fourier Transform(Autocorrelation(Process))) (and not estimate directly as Fourier Transform(realization)²) $\endgroup$ Commented Mar 13, 2019 at 7:49
  • $\begingroup$ Thanks you for kind suggestions. I will think about it. The MATLAB code to generate the waveform is provieded in the edited part. $\endgroup$
    – Ang Zhou
    Commented Mar 14, 2019 at 2:37

1 Answer 1

1
$\begingroup$

Here is a stab.

Start with:

$$ \ddot{u} - 2\beta \dot{u} +(\omega^2+\beta^2)(u-s)=0 $$

Take the derivative:

$$ \dddot{u} - 2\beta \ddot{u} +(\omega^2+\beta^2)(\dot{u}-\dot{s})=0 $$

Now, $ \dot{s} = 0 $ Wherever it is defined. So:

$$ \dddot{u} - 2\beta \ddot{u} +(\omega^2+\beta^2)(\dot{u})=0 $$

Let $ v = \dot{u} $, and you get

$$ \ddot{v} - 2\beta \dot{v} +(\omega^2+\beta^2)v=0 $$

Which is an ordinary second degree linear differential equation. v will have the same frequency as u.

The most basic (good) differential approximation is:

$$ d[n] = \frac{u[n+1]-u[n-1]}{2} $$

So run that over your data and see what you get and please add a chart to your question with the results.

I think you may best solve this one by analyzing the zero crossing of those results. The transitions are going to cause weirdness as your system "falls" towards the new equilibrium.


Followup:

A more traditional approach perhaps.

$$ \ddot{u} - 2\beta \dot{u} +(\omega^2+\beta^2)(u-s)=0 $$

Your homogenuous equation is:

$$ \ddot{u} - 2\beta \dot{u} +(\omega^2+\beta^2) u=0 $$

with solutions:

$$ u_h = \left[ C_1 \cos( \omega t ) + C_2 \sin( \omega t ) \right] e ^ { \beta t } $$

And your particular equation is:

$$ \ddot{u} - 2\beta \dot{u} +(\omega^2+\beta^2) s=0 $$

Assume:

$$ u = a t^2 + b t + c $$

$$ \dot{u} = 2 a t + b $$

$$ \ddot{u} = 2 a $$

$$ (2a) - 2\beta ( 2 a t + b ) + (\omega^2+\beta^2) s=0 $$

$$ (2 - 4 \beta t) a - 2\beta b + (\omega^2+\beta^2) s=0 $$

$$ a = 0 $$

$$ b = \frac{\omega^2+\beta^2}{2\beta} \cdot s $$

So :

$$ u_p = \left( \frac{\omega^2+\beta^2}{2\beta} \cdot s \right) t $$

For any range of consistent $s$ you now have your general and particular solutions.

Therefore you should only need five points to solve for your five unknowns: $ \omega, \beta, C_1, C_2,$ and $ c $.

With noise, that goes out the window. If you take the second derivative, your particular solution will be squashed completely. Then you should only have to worry about the $s$ transition points.

Line crossings will give you $\omega$, and the envelope will give you $\beta$.

$\endgroup$

Your Answer

By clicking “Post Your Answer”, you agree to our terms of service and acknowledge you have read our privacy policy.

Not the answer you're looking for? Browse other questions tagged or ask your own question.