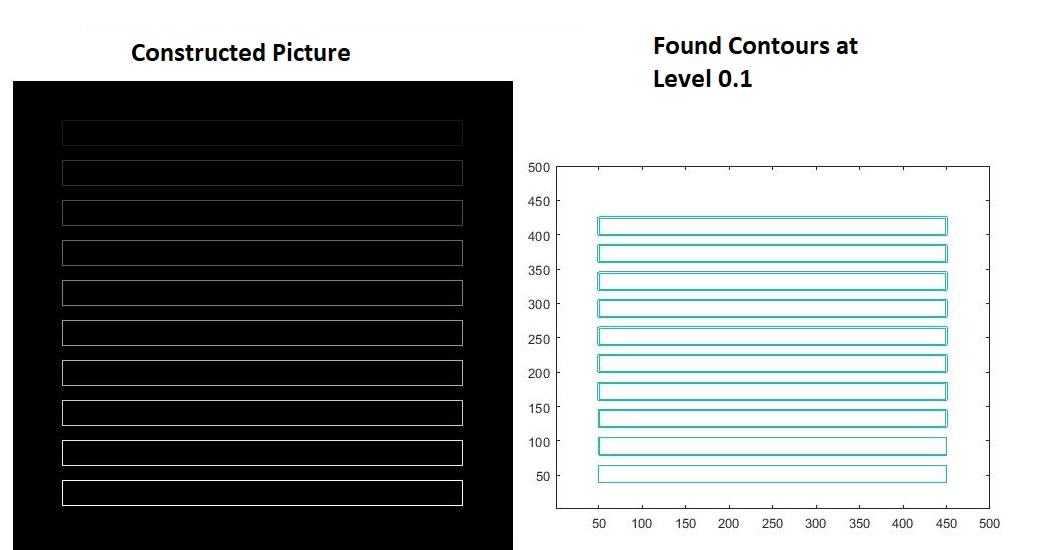
I have been trying to understand what the contour levels are.
As far as I understand a contour of the function $Z(x,y)$ is a set of points in the $(x,y)$ plane, such that $Z(x,y)$ is fixed at some constant value, that constant value is the contour level.
Matlab docs state that the contourc function takes an argument that determines the levels upon which the contours are computed.
I wanted to try that out, so I constructed a picture with $10$ rectangles, each of which has a distinct depth starting from $0.1$ ending up at $1.0$, and I ran the contour function to see the highlighted contours according to the specified levels in the input, but the results weren't expected.
For instance, I ran the code on $0.1$ contour level and the contour function produces all the contours in the picture, not only the ones with $0.1$ level.
Here is the Matlab code used to construct the picture and find its contours:
pic = zeros(500, 500);
val = 0.1;
shift = 40;

for j = 1:10
  for i= 50:450
    pic(shift*j,i) = val;
  end
  for i= 50:450
    pic(shift*j+25,i) = val;
  end
  for i = shift*j: shift*j+25
    pic(i, 50) = val;
    pic(i,450) = val;
  end
  val = val + 0.1;

end

imshow(pic);
figure(2);
contour(pic, [0.1 0.1]);
I'd be so grateful if someone could clue me in.


contourwithout the second argument $\endgroup$