I am working with machine learning for time series classification. I am trying to extract features from the amplitude spectrum.
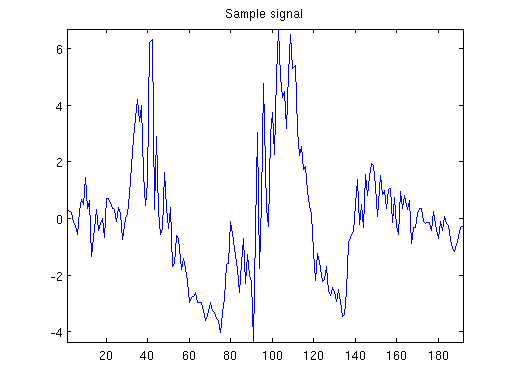
My current concern is that I cannot tell the length of the signal in advance. Here's one example signal with $N=192$ observations, corresponding to approximately 2 seconds of data collection:
I do not have an upper bound on the length of the signal, although more than 1,000 observations usually indicate I have an outlier.
My approach has been to take the input signal $x=(x_1,x_2,\ldots,x_N)$ and then find the one-sided amplitude spectrum from its N-point DFT:
- $\mathcal{F}(x) = (X_1, X_2, \ldots, X_N)$
- $A(X)=(|X_1|, |X_2|, \ldots, |X_{\frac{N}{2}+1}|$)
Given that my sampling rate is approximately $f_s=100\,\text{Hz}$, I figured I would interpolate the one-sided amplitude spectrum to 51 points. (PS: I made a mistake here; please see clarification below.)
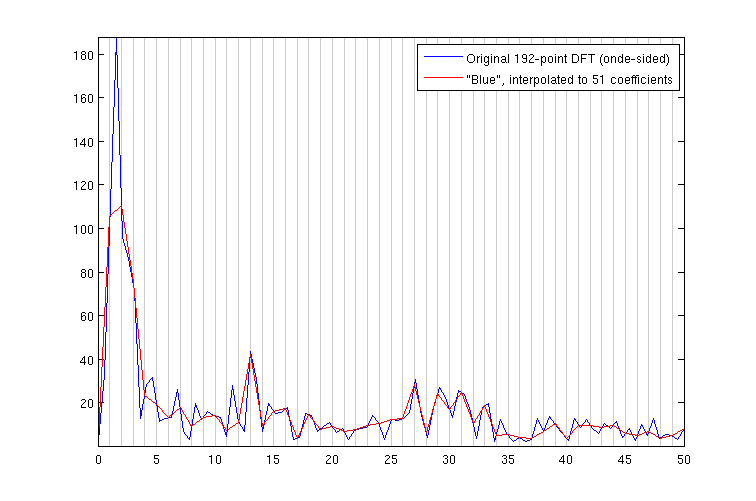
This procedure gives me a 192-point DFT and a one-sided amplitude spectrum with 97 coefficients, which I interpolate to 51 (linear interpolation). For comparison, here's the original amplitude spectrum and its interpolation. The horizontal axis is given in Hz.
They don't look very different. However, the features I take from the spectrum are such as short-term energy, variance, standard deviation, number of peaks, and location of the first peak, as well as the magnitude of specific coefficients (am I right in saying that's the energy at those bins?). So different approaches in finding those 51 coefficients can lead to quite different results.
Also, I have the impression that interpolating the amplitude spectrum is just plain wrong. Looking at the figure, it seems obvious that the interpolation made me lose a lot of energy content in the range near 0-5 Hz.
For disclosure, I did check each related question suggested by Stack Overflow as I wrote mine. The most similar question to mine seems to be "How to combine bins of my DFT", however I believe I have several additional doubts---to start with, I'm eager for criticism on whether I am doing the right approach in taking the absolute value of the Fourier coefficients and then trying to reduce the number of bins, or whether I should zero-pad my signal to a number of observations that is a multiple of 50 (and thus hopefully avoid leakage? I don't know, I'm really struggling to understand the subject and I might be working with several misconceptions here; any corrections will be appreaciated)
PS: I made a mistake in my assumptions. I incorrectly assumed Matlab's interp1 function interpolates over a set of query points and averages the values in-between. What it is in fact doing is downsampling.
PPS: here's the code for coefficient reduction:
qp = (0:50) * (numel(X) - 1) / (50) + 1;
X50 = interp1(X, qp);


interp1but is there more to it? Can you post this part of your code? $\endgroup$X[1]throughX[N/2 + 1], so I just scale the sequence of points 0..50 accordingly and callinterp1to queryXon the scaled points, then add 1 because Matlab index from 1. But again, I am not required to useinterp1or anything similar. I just want to estimate the frequency content at specific bins, regardless of the length of the series. $\endgroup$