2
$\begingroup$

I have a non uniform sampling frequency signal and I have to convert it in a constant sampling frequency. I tried to interpolate it with an Hermite spline interpolation but it make a lot of wrong peaks, like in the figure: enter image description here
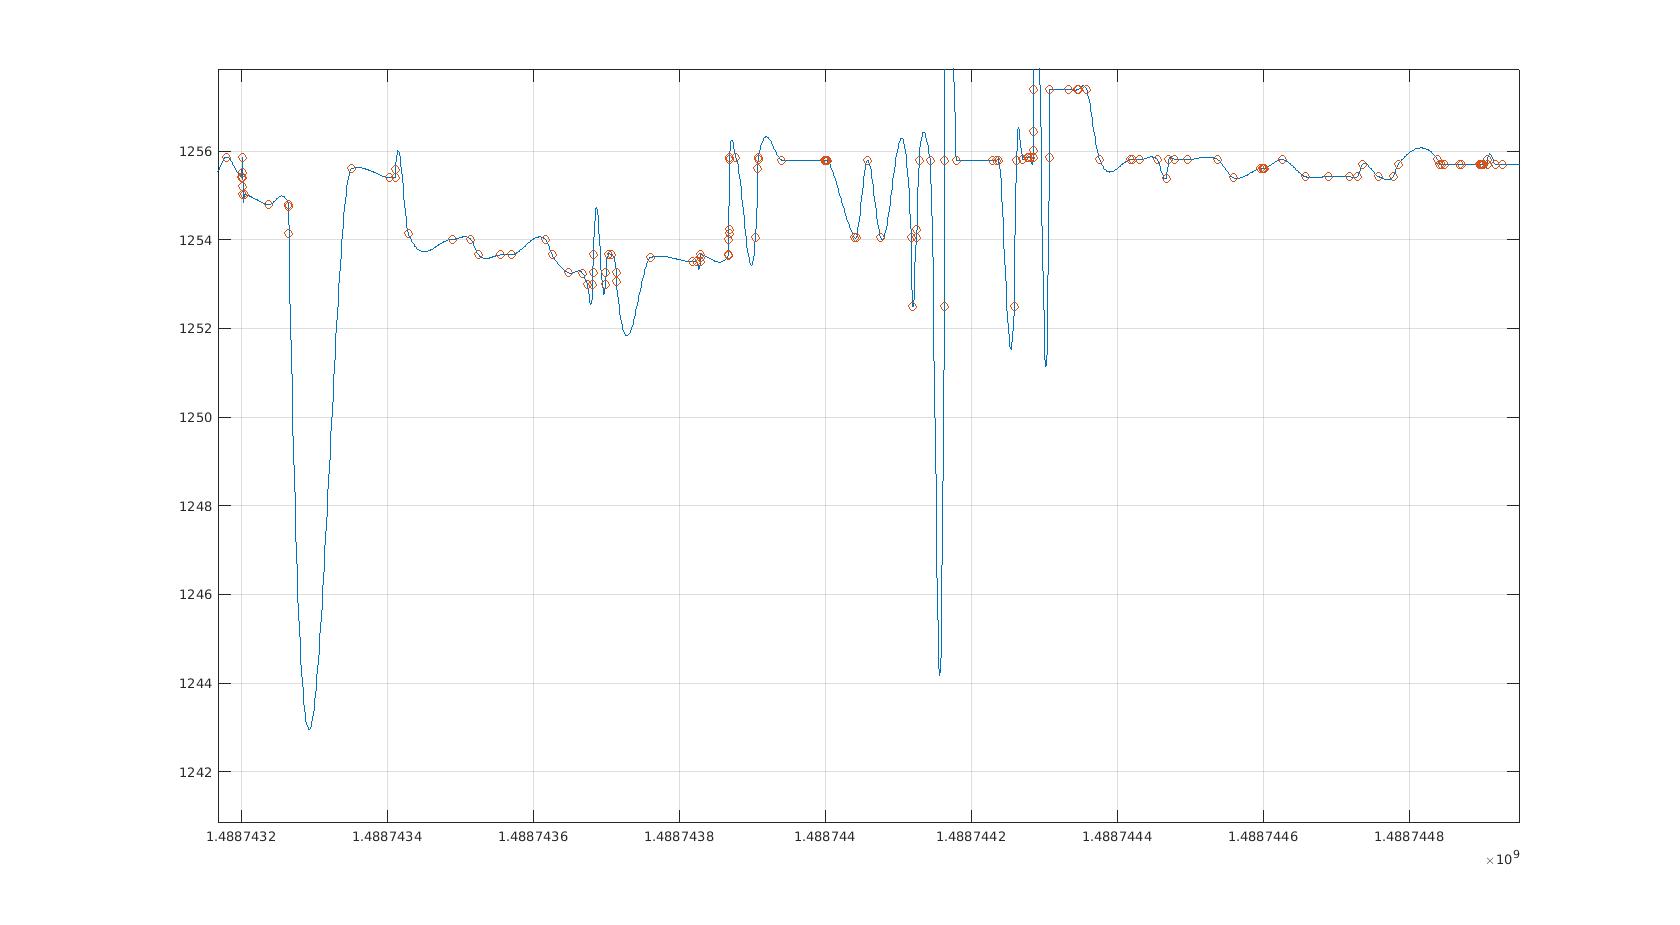
For example at 14887433 there is a peak too big.

A cubic (4 point) interpolation is too sharp for me.

Which method can I use to resampling this signal? Is there a way to filter a not constant sampled signal in order to use a sinc or a similar window?

$\endgroup$
4
  • 1
    $\begingroup$ At a first glance, you may need regularization, smoothing (en.wikipedia.org/wiki/Smoothing_spline) or interpolants passing through the dots. However, do you have additional assumptions on the data? What is your target rate? What is the aim of the subsequent processing (or the need for uniform sampling)?And could you share the data? $\endgroup$ Commented Apr 25, 2017 at 19:05
  • $\begingroup$ Thank you smoothing spline seems to be the best solution $\endgroup$
    – Andrea
    Commented Apr 26, 2017 at 7:59
  • $\begingroup$ This question is missing important information. Hence, it cannot be answered in its current form. How is the sampling pattern selected? Is it adaptive, random, gird-based? Furthermore, no information about the original (continuous) signal is given. $\endgroup$
    – msm
    Commented Apr 26, 2017 at 10:35
  • 1
    $\begingroup$ Unfortunately I have not other information. I have to understand what this data is. $\endgroup$
    – Andrea
    Commented Apr 26, 2017 at 13:43

2 Answers 2

3
$\begingroup$

Without specific constraints on the data/noise properties or sampling assumptions, smoothing splines could be helpful. Indeed, constraining the curve to pass exactly through the given points could be too harsh.

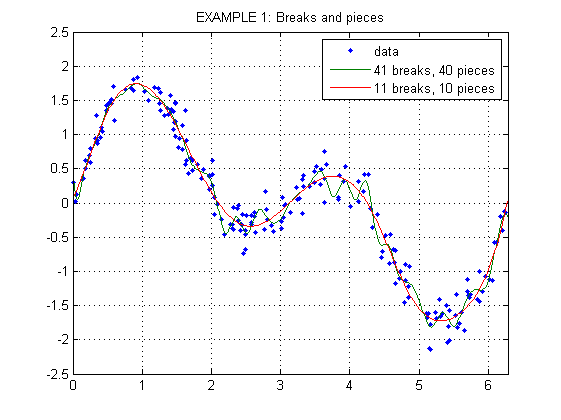
One example of such a toolbox in Matlab is SPLINEFIT with several examples:

spline fitting

Direct spline interpolation of noisy data may result in a curve with unwanted oscillations. This is particularly bad if the slope of the curve is important. A better approach is to reduce the degrees of freedom for the spline and use the method of least squares to fit the spline to the noisy data. The deegres of freedom are connected to the number of breaks (knots), so the smoothing effect is controlled by the selection of breaks.

Matlab also has Cubic smoothing spline (csaps).

One possible reading:

$\endgroup$
1
$\begingroup$

If you want to make sure that your interpolation stays within the bounds of sampled points (no over or under swings) use Piecewise Cubic Hermite Interpolating abd chose the derivatives at the boundary so that the function preservces monotonicity.

Matlab explains it https://www.mathworks.com/help/matlab/ref/pchip.html

$\endgroup$
1
  • $\begingroup$ I have already tried Piecewise Cubic and I have wrote that it's too sharp. $\endgroup$
    – Andrea
    Commented Apr 26, 2017 at 7:58

Your Answer

By clicking “Post Your Answer”, you agree to our terms of service and acknowledge you have read our privacy policy.

Not the answer you're looking for? Browse other questions tagged or ask your own question.