2
$\begingroup$

I have an MRI K-Space data 320 x 320 x 256 x 8 (4D complex double) from < mridata.org > . The data represents 320 x 320 K-Space of 256 slices from 8 channels. I am trying to reconstruct images for each slice. Here is the matlab code I tried:

% Version - 1
kspacedata= kspacefile.kdata;
imRef = ifftshift(ifftn(kspacedata));
imSOS    = squeeze(sqrt(sum( abs(imRef).^2, 4))); % sum-of-squares to combine all channels

% Version - 2
kspaceSlicedata = kspacedata(:,:,100,:);
imSliceRef = ifftshift(ifftn(kspaceSlicedata));
imSliceSOS    = squeeze(sqrt(sum(abs(imSliceRef).^2, 4))); % sum-of-squares to combine all channels

% Plotting
figure;
subplot(1,2,1); imagesc(imSOS(:,:,100));title('Version - 1');axis image; colormap(gray);
subplot(1,2,2); imagesc(imSliceSOS);title('Version - 2');axis image; colormap(gray);

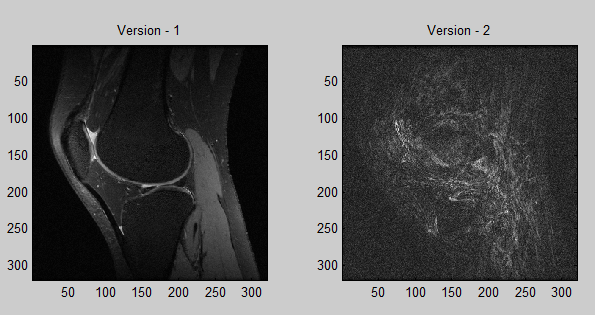
In Version - 1, I take inverse transform on entire kspace data and plot image data corresponding to slice 100. In Version - 2, I take kspace data corresponding to slice 100 and do inverse transform on this kspace and plot the image data. Here is the output images I obtained.

enter image description here

I thought both versions will reconstruct the same way. But images appeared different. How can I take kspace data corresponding to one slice and perform inverse transform to reconstruct slice image?

Thanks.

$\endgroup$

1 Answer 1

2
$\begingroup$

The two reconstructions are both valid in general. In MRI images can be acquired in multiple 2D slices and as a 3D volume.

When data is acquired in slices, you would take the 2D Fourier Transform of the k-space of each slice (and each channel, if it is a multi-channel coil). Then you would sum the channel data up in a Sum of Squares fashion as you did. The result would be the reconstructed slices.

When data is acquired in a true 3D mode, you do not have separate k-spaces, but only one big k-space. To reconstruct this data, you would do a 3D Fourier Transformation of your k-space (and do so separately for each channel, if the coil had multiple channels). After a Sum of Squares summation of the channel, you have reconstructed the whole volume.

You can easily check, if you data is acquired in 2D or 3D mode: Take the absolute of your k-space data. If you have only one maximum in your data (one DC component), data was acquired in 3D. If there are multiple maxima in the same order of magnitude (one per slice), then data was acquired in 2D mode.

Note that you cannot replace a 3D FFT by applying 2D FFTs for each slice. That is why your second reconstruction failed. Look at an orthogonal "slice" to what you have shown - you will clearly see the typical k-space modulation with the maximum intensity in the middle.

Hope that helps.

$\endgroup$
0

Your Answer

By clicking “Post Your Answer”, you agree to our terms of service and acknowledge you have read our privacy policy.

Not the answer you're looking for? Browse other questions tagged or ask your own question.