So I'm having some trouble conceptually and am hoping somebody can clear something up for me. This is long and I apologize for that but I want to provide as much information as possible so that the source of my confusion might be exposed.
I have a signal with a sampling rate of $74767 { samples \over sec}$. I want to take the spectrogram in matlab of this signal but I'm really only interested in the content in the first $1\over2$ second. Now, if I throw out everything after 0.5 seconds and attempt to compute the spectrogram using the time-frequency tool box I've posted the link to below. (it's required I use this one) I run out of memory. To solve this I decided to keep only every $X$ samples so that I'm working with less data. This will effectively, I assume, lower my sampling frequency by a factor of $X$. That is to say then that I first throw away everything after 0.5 seconds, and then keep only ever $X^{th}$ sample. My total signal length is then equal to: $$N = {74767 \times 0.5 \over X}$$
My new sampling frequency should therefore be twice this value as that would be, hypothetically, the number of samples I would have collected in one second.
$$ f_s = 2 \times ({74767 \times 0.5 \over X}) $$
I'm having two issues however with this.
The first is that I'm slightly confused about the frequency resolution and number of bins for my spectrogram.
I have to pass to the spectrogram calculation the number of frequency bins I want to calculate. I always pass it the length of the signal, which as discussed above is $N = {74767 \times 0.5 \over X}$. Now, I know that to plot this with the proper scale I need to know what my frequency resolution is per frequency bin. This is going to always be 2 because the frequency resolution is: $$ freq_{res} = {f_s \over N} = {1 \over T} $$
As I've shown above, I reasoned this out, but it seems that if I increased $N$ and thereby sampled at a higher rate, then I would have more samples per second in a half-second time frame and my frequency resolution should be higher! I mean after all, if I'm looking from 0 to 0.5 seconds, and didn't have to divide by $X$ because of the memory limit, then why wouldn't I have a higher frequency resolution? I would have more samples!
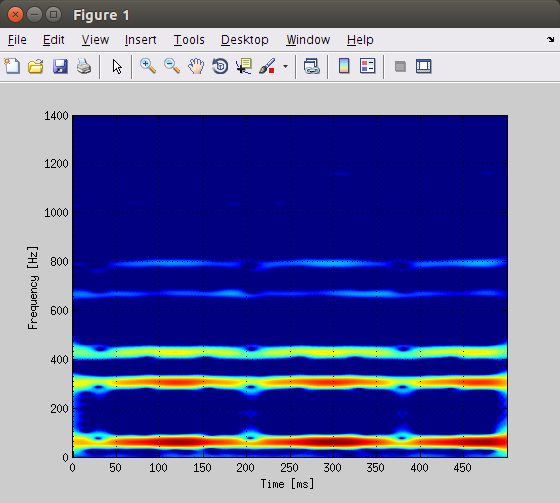
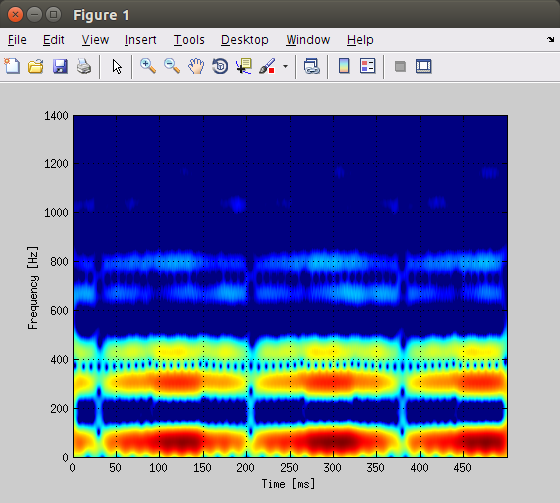
The second issue I'm having trouble with is understanding the resolution of the spectrogram with respect to the number of frequency bins given by $N$. Clearly I can choose $X$ to vary $N$. As a test I included $N=3000$ and $N=8000$ below. As $N$ gets larger I start to lose precision in the frequency domain. This makes sense as I know the uncertainty principle tells us that there is a balance between precision in the frequency vs time domain. However, how do I know what a good value of $N$ is? My highest frequency content I really care about is the 25th harmonic ($60 Hz \times 25 = 1500 Hz$). Does that mean that I should perhaps choose a value of $X$ that makes my sampling frequency twice the Nyquist (in my case that would be $3000 Hz$). Doing that I get:
$$ 3000 Hz = 2 \times ({74767 \times 0.5 \over X}) $$
$$ \therefore X = {{74767 \times 0.5} \over 1500 } \approx 25$$
However, when I plot that my localization in the frequency domain is great, but my localization in the time domain is pretty terrible, I've included a plain-text link screenshot of it below as well.
What then, is a good metric to decide on my localization in the time domain? And how do I reconcile the seeming contradiction above? Thank you for any help and/or advice.
N = 3000
N = 8000
N = 1495. X = 25
Plain-text Link for image found here: https://i.sstatic.net/1HLTL.png
(I don't have enough Karma to post more than 2 links).
TFT Toolbox: tftb.nongnu.org/


outputdata = resample(inputdata,1,x), which will take only one out of $x$ samples in a proper way by applying an anti-aliasing filter. $\endgroup$