I'm very new to signal processing and attempting to implement a spectrogram generator to learn more about DSP in general. So far, I have built up an understanding of how I might do that.
- Get input signal
- Window the data (e.g. split up the samples into 1024 sample long chunks)
- Apply a windowing function
- Zero-pad the data (optional)
- Compute the FFT of each window
- Get the magnitude for each frequency
- Plot a spectrogram by laying each window side-by-side
I've also read that to reduce spectral leakage and other artifacts, one should apply an overlap between each window. Most recommend an overlap of 50%. This means that the first half of each window's data is copied from the tail end of the previous window. If my understanding is correct, this results in about twice as many windows, but the length of the window remains the same (e.x. 1024 samples with a 512 sample overlap).
When plotting these windows side-by-side, won't it also double the length of the time axis, since each window now refers to an interval covered by a previous window?
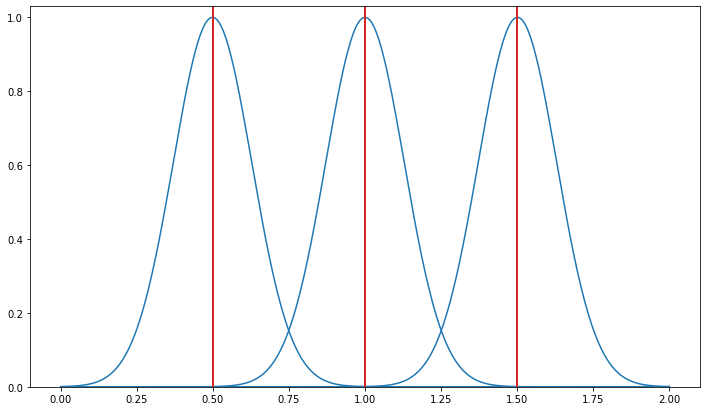
For example, if I have a 2s long signal where each window is 1s long, assuming a 50% overlap, I'll have a windows on the interval [0-1], then [0.5-1.5], then [1-2]. Laying these windows out side-by-side would result in a 3s long time axis.
I'm sure that I've misunderstood the transformation of the windowed FFT information into a spectrogram. Can someone clarify my understanding?

