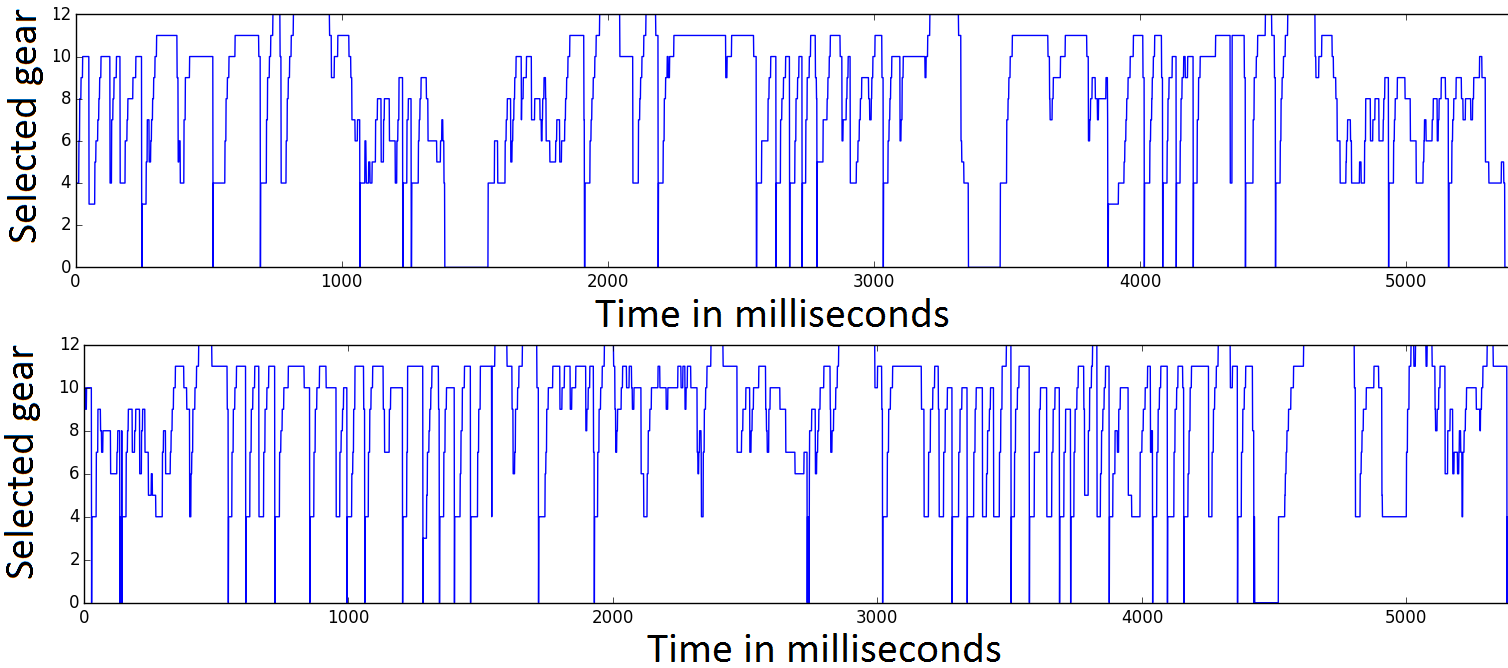
In addition to the features mentioned so far I would like to mention measures of complexity such as:
There are also Fourier Descriptors (as hinted by Drazick already) and their equivalent in Wavelet Analysis and of course simple histogram bins which would return how frequently each gear is engaged en route.
But also, that you will sooner or later need to put these features and the results of analysis involving them in some context relevant to the real world. This will give some sort of meaning to these quantities.
For example, a mean value would provide information about the gears mostly used in the "average" route the vehicle was running on while data capture was taking place (e.g. mostly lower gears, or mostly higher gears). Variance could provide a measure of the range of gears used en route. A simpler measure of gear change could be the amount of different states the gear box seems to be going through, per unit of time. For example 3.5 gear changes per minute. You can use these to cluster the data into frequent and less frequent gear changers and investigate the question of whether or not frequent gear changes have an impact on gearbox failure, if gearbox failure is mostly associated with lower gears (i.e higher load) and other.
Just blindly calculating features off of the waveforms and using them to bundle cases together is not going to be enough, sooner or later you are going to have to ask yourself "What does this mean in the real world?"
Hope this helps.

