7
$\begingroup$

I am trying to detect if a car did accelerate or did brake by using the accelerometer of the iPhone.

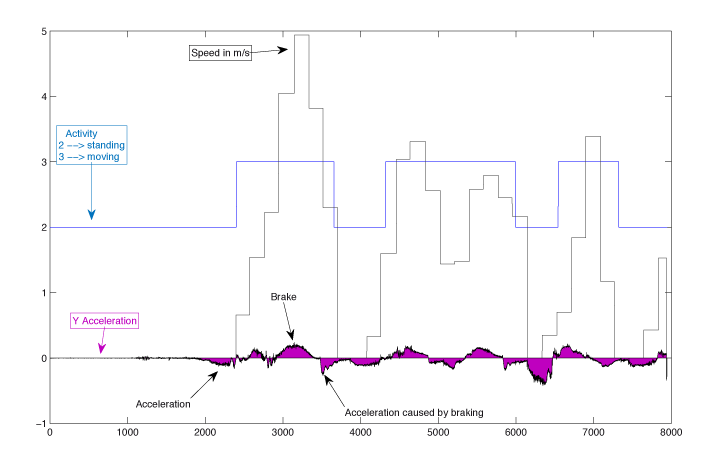
In the figure below I plotted the collected data. (To collect the data the phone was laying flat in the car facing the top of the phone to the front).

The issue I am having now is that visually I can clearly see where the car accelerated and where it did brake (see below). But can't figure out how to do that programatically.

What I basically want is to know how often a car did brake or accelerate during a certain time window. (Window size around 10-30 seconds).

Any help would be highly appreciated.

Thanks in advance! Acceleration | Braking of a car

$\endgroup$
9
  • $\begingroup$ What is the unit on the $x-\text{axis}$ ? $\endgroup$
    – Gilles
    Commented Aug 19, 2014 at 22:23
  • $\begingroup$ The unit of the x axis is time. I sampled with 60 Hz. So the values on the x axis divided by 60 would represent seconds. $\endgroup$
    – riik
    Commented Aug 20, 2014 at 6:56
  • $\begingroup$ Okay it's the number of samples. One way would be getting a sliding window of the size you're suggesting and putting conditions on the mean and variance of the collected samples , if necessary adding conditions on zero crossing intervals. But if you do the analysis without the short-time windows, can't the number of rising edges of the activity signal (blue signal) give you how many times you've accelerated, and falling edges for breaking ? $\endgroup$
    – Gilles
    Commented Aug 20, 2014 at 8:04
  • 1
    $\begingroup$ @PaulR thanks for the clarification! I just updated the question accordingly. $\endgroup$
    – riik
    Commented Aug 20, 2014 at 13:23
  • 2
    $\begingroup$ OK, if you use the accelerometer data, you could in principle just use the sign of the acceleration (- for braking, + for accelerating). The problem is the noise. Probably you can sufficiently increase the SNR by using a Savitzky Golay filter. $\endgroup$
    – Matt L.
    Commented Aug 20, 2014 at 15:53

3 Answers 3

1
$\begingroup$

You should consider doing an STFT on the accelerometer signal. This will allow you to visualize the frequency of the signal. If you can determine the frequency of the brakes, you should be able to set a threshold for that specific braking frequency and count each time it is exceeded. You would also be able to measure how long the braking occurs.

How are you processing your signal? Matlab and python have the specgram function, which will allow you to see the actual frequency braking. From there you will be able to determine the brake frequency as well as a threshold.

$\endgroup$
1
$\begingroup$

When brakes are applied, the acceleration along the direction of motion will reverse sign. For example, if you position your phone such that the z-axis of the accelerator is in the direction of gravity axis(i.e. facing earth), then the acceleration along z-axis is -g. One the other hand if the negative z-axis is aligned with g, then z-axis of accelerometer measures +g. This is analogous to the scenario of a car accelerating and braking, although magnitude of deceleration is a little lower than acceleration. You can start by defining the reference axis as the g-axis and defining the other 2 axes based on direction of least and maximum acceleration, using a rotation matrix. You basically change the reference axis from x,y,z co-ordinates which is based on orientation of the phone to an stationary g,a,s reference system (where g is gravity axis, a is direction of maximum acceleration and s stationary axis). You can also use a gyroscope to achieve this axis rotation as discussed in this page. One you are able to view to the accelerometer daya in the transformed axes, you can easily classify regions of acceleration and deceleration based on signal from just one axis regardless of the orientation of the phone by looking for zero crossings.
$\endgroup$
1
$\begingroup$

You should know the orientation of the phone because the axis signum must be the same of the car motion. Assuming the axis signum is correct you can filter the accelerometer signal in lowpass, to clean the high frequency noise and then see the signal signum to detect if it is a break $a(t_i)<0$ or an acceleration $a(t_i)>0$.

You should try to filter with a butterworth low pass of the second or third order with a low frequency for example $10Hz$ or also less, you should try some cut frequencies looking the graphic.

$\endgroup$

Your Answer

By clicking “Post Your Answer”, you agree to our terms of service and acknowledge you have read our privacy policy.

Not the answer you're looking for? Browse other questions tagged or ask your own question.