4
$\begingroup$

suppose I have a 4 seconds signal captured at $f_s$ = 1024Hz, which gives 4,096 data array. What is the different between these 2 FFT methods (MATLAB code)

[1] FFT the entire input with 4096-points FFT

N = length(input);
Y = fft(input)/N;

[2] Divide the input into 8 segments (4096/8=512 data point each), and feed each segment to 512-points FFT, and then average the output:

N = length(input);
Y = zeros(1,512);
for i = 1:8
  segment = input(512*(i-0)+1 : 512*i);
  Y = Y + abs(fft(segment,512))/512/8;
end

Question #1: Are these 2 methods equivalent?

Question #2: Is the frequency resolution for both methods equal to $\frac{f_s}{N}$ = 0.25Hz per bin?

$\endgroup$

3 Answers 3

2
$\begingroup$

Question #1: Are these 2 methods equivalent?

No, method #1 is taking an FFT of the entire sequence resulting in frequency bin widths of fs/N = 1024/4096 = 0.25 Hz. Method #2 is summing shorter FFTs at a frequency resolution (bin width) of 1024/512 = 2.0 Hz. For #2, if you divide by the number of FFTs after you sum them you are then averaging them. This is often times used to reduce the variance of the result.

Question #2: Is the frequency resolution for both methods equal to 0.25Hz per bin?

No, they are 0.25 & 2.0 Hz. The resolution, or bin width, of the FFT is fs/N.

$\endgroup$
2
  • $\begingroup$ So the frequency resolution should be calculated based on the FFT-length rather than the total sample acquired then? But according to this the frequency resolution is solely based on the total acquired time T. FR = 1/T = fs/N, where N = total sample acquired? How to apply the concept in this example? Thanks $\endgroup$
    – cpmame
    Commented Dec 26, 2013 at 19:11
  • 1
    $\begingroup$ My N is the FFT length, where the link you've provided uses N as the number of time domain samples captured. $\endgroup$
    – porten
    Commented Dec 27, 2013 at 21:53
0
$\begingroup$

You are absolutely correct, the frequency resolution $f_R$ (or bin width) should be calculated based on the length of FFT, $N_{FFT}$ (i.e. $f_R=\frac{f_s}{N_{FFT}}$), instead of the length of the original captured signal $N$.

I believe most journals/books out there simply assume ($N=N_{FFT}$) in their sample calculation, and use the notation of $f_R=\frac{f_s}{N}$ throughout their books/papers. But when $N{\neq}N_{FFT}$ as in method #2, then the $f_R=\frac{f_s}{N}$ could to lead confusion among newbies (like myself). So a safer way is to use $f_R=\frac{f_s}{N_{FFT}}$ instead.

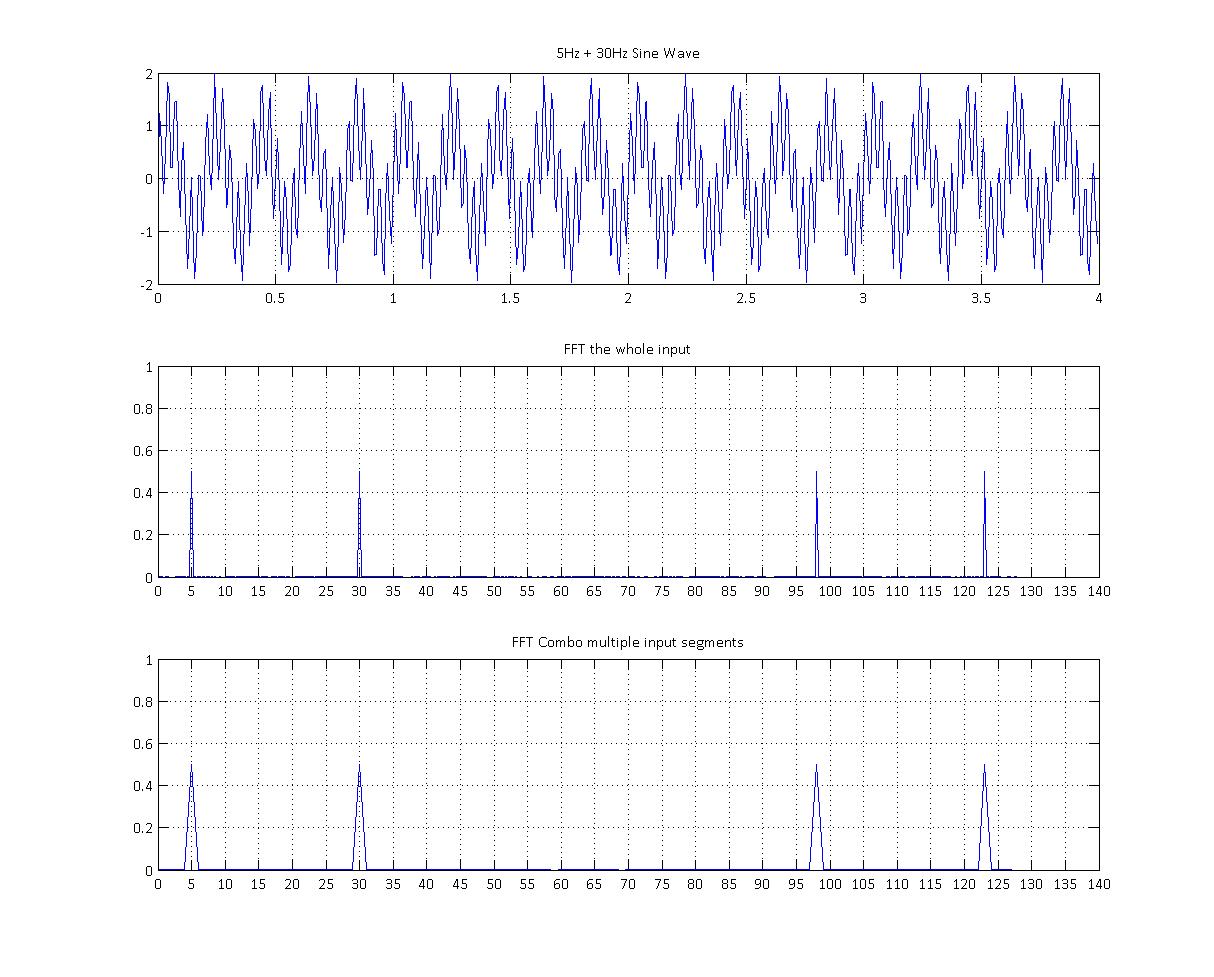
To prove this, below are the output of 5Hz + 30Hz sinusoids ($f_s$=1024Hz, duration=4s, 4096 data points), and it's output with the FFT-512, and FFT-4096 respectively. You can see the frequency resolution (or bin width) of the FFT-512 output (3rd plot) is wider than FFT-4096 (2nd plot), since $\frac{f_s}{512}>\frac{f_s}{4096}$.

enter image description here

$\endgroup$
1
  • $\begingroup$ Please stop chopping / changing / rolling back your question. Is there something wrong? Let me know, and let's try to get it right. I've locked this question for a week, so no one will be able to change it until it's unlocked. $\endgroup$
    – Peter K.
    Commented Nov 11, 2015 at 20:19
-1
$\begingroup$

The frequency resolution of a DFT operation is solely dependent on the #of samples ($N_s$)only. Taking a larger than $N_s$ length DFT implicitly makes use of zero-padding in matlab. This does not increase the frequency resolution (though it may appear so when you see the plots) and rather makes use of spectrum obtained without zero-padding to interpolate to the increased DFT length sample values. This operation helps in smooting the appearance of the spectrum and resolving potential ambiguities between the peaks.

In your case you are dividing the signal into frames and DFT of each frame will have thus a lower fundamental resolution (dependent on the number of sample you use 512 now). You are seeing good resolution (though the second case has poor resolution than first) because the sampling fvequency is much higher than the signal content frequencies hence you have captured enough number of cycles of the constituent components in both cases.

The approach of dividing the signal into frames and doing then averaging the resulting spectrum^2 (energy in the frequency domain) is used in power spectral density computation of stochastic (deterministic (sine waves)+noise) signals where number of available samples is always a limitation, hence it is appropriate to deduce interpretation from an average PSD than a single PSD estimate.

$\endgroup$

Your Answer

By clicking “Post Your Answer”, you agree to our terms of service and acknowledge you have read our privacy policy.

Not the answer you're looking for? Browse other questions tagged or ask your own question.