I am looking for an algorithm to measure attenuation of a discrete signal $s[t]$. Starting at the beginning of the signal sequence, is it possible to compute either sliding DFT or Gabor transform windows and use the amplitude and phase information to compute an attenuation coefficient? Is a reference available for such an algorithm? I am wondering if similar algorithms have been applied in music DSP.
Is there a separate attenuation coefficient computed for both the real and complex parts of the frequency-domain signal?
Here are some further details:
- For each window, I want to compute attenuation of the signal. So for every $\tau$, where $\tau$ is the center of the window, I get an estimate of attenuation over the width of the window. As the window moves over the signal $s[t]$, I get an estimate of attenuation $\alpha[\tau]$ as a function of the window center.
- Sliding DFT is used for computational efficiency (link), and I think that there may also be other benefits to using the sliding DFT as well. Should I apply a Blackman/Hanning window in the time domain? Or perhaps the Gabor transform would suffice.
- $s[t]$ is considered to contain a single signal of interest.
- The attenuation coefficient can be expressed with a real part and a complex part, and can be reported in units of dB. Here is an equation:
$A = A_0 \exp[\frac{{ - \omega \tau }}{{2\alpha }}]$
$A$ is the amplitude and phase at a time $\tau_k$, and $A_0$ is some reference amplitude and phase, $\alpha$ is the attenuation coefficient, $\tau$ is the time at the window center, and $\omega$ is angular frequency.
How do I define the reference amplitude and phase $A_0$? Maybe $A_0$ would be defined at the beginning of the signal. Or maybe $A_0$ would be defined at the beginning of each window? In addition, how do I deal with spikes in the signal spectrum? Maybe some sort of smoothing algorithm would be beneficial here?
Moreover, maybe the attenuation could be determined using a signal envelope detector? How might I set this up?
UPDATE
I think this problem might be associated with separating two signals that have been added together. We don't know the reference amplitude $A_0$ and it might change over time. Take:
$A[\tau, \omega] = A_0[\tau, \omega]\exp[\frac{{ - \omega \tau }}{{2\alpha }}]$
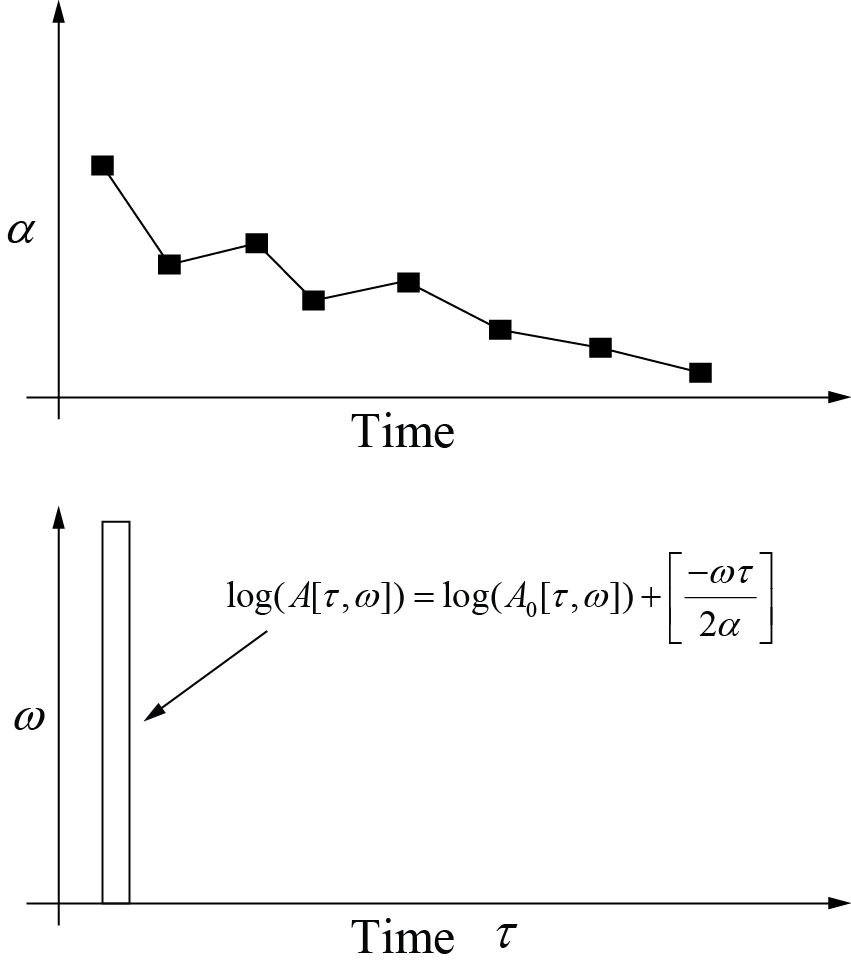
$\log(A[\tau, \omega]) = \log(A_0[\tau, \omega]) + [\frac{{ - \omega \tau }}{{2\alpha }}]$
Here are some assumptions:
- $A_0[\tau, \omega]$ is unknown, but it can be assumed as being uncorrelated with $[\frac{{ - \omega \tau }}{{2\alpha }}]$. The bandwidth of $A_0[\tau, \omega]$ is different than the bandwidth of $[\frac{{ - \omega \tau }}{{2\alpha }}]$. (I think this is reasonable.) The bandwidth of the $[\frac{{ - \omega \tau }}{{2\alpha }}]$ expression is known.
- $\alpha$ is constant for each $\tau$.
- $A[\tau, \omega]$ is computed using the Short Time Fourier Transform or Gabor transform.
- The envelopes of $A[\tau, \omega]$ and $A_0[\tau, \omega]$ are not constant. However, $\exp[\frac{{ - \omega \tau }}{{2\alpha }}]$ is just an equation. So can I treat $A_0$ as simply being "noise" or something else?
- $A_0[\tau, \omega]$ and $A[\tau, \omega]$ are complex. The attenuation $\alpha$ is a real number.
Can someone help me set up the math (i.e. matrix equation?) or point me in the right direction to a class of algorithms? I think this problem is very similar to separation of two signals.
Perhaps this can be done using a Kalman filter, where $\log(A_0[\tau, \omega])$ is treated as "noise" and the $[\frac{{ - \omega \tau }}{{2\alpha }}]$ term is treated as the signal. Is this reasonable, and is there a good reference available on the implementation of this filter? Perhaps another filter would be more appropriate?
The output of the operation would be a graph of attenuation with respect to time, as I have drawn below. I also show the Gabor transform operation with the addition of two signals.
UPDATE
To explore this problem more, I've selected a test signal and written a program to forward filter the test signal using a kernel that simulates the attenuation I want to determine. I work with sonar and acoustic sensing systems, so selecting this signal demonstrates what I am working with.
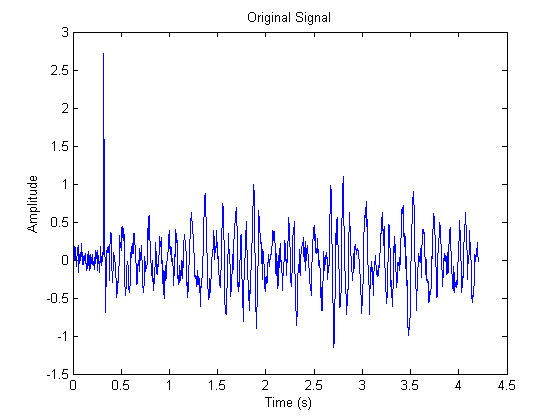
Here is a plot of the test signal in the time domain. This is a signal with no attenuation:
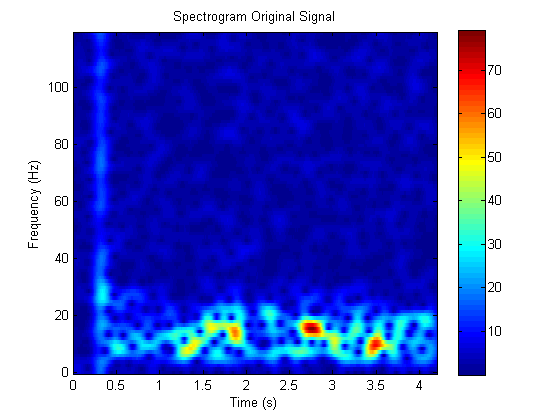
Here is the Gabor transform (spectrogram) of the signal with no attenuation:
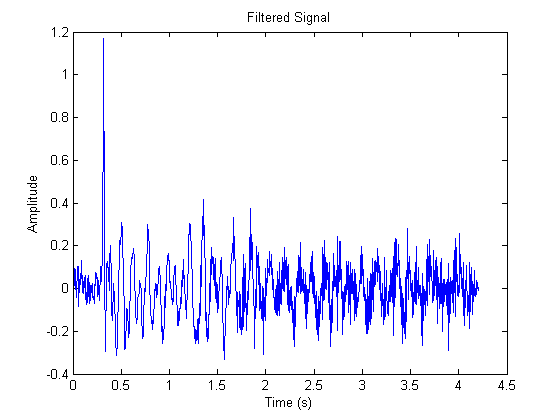
Here is a plot of the test signal after I've applied a filter to simulate attenuation. This is a signal with constant attenuation, such that $\alpha(\tau) = 55$:
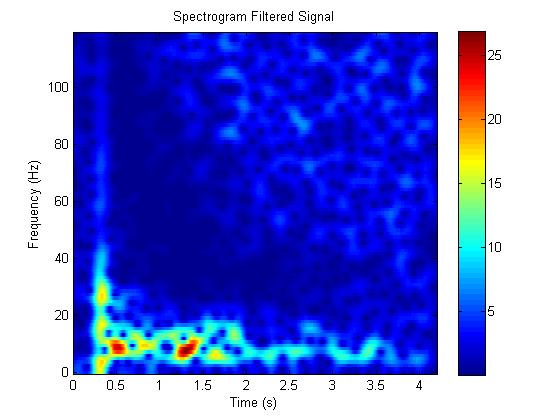
Here is the Gabor transform (spectrogram) of the signal with attenuation. Notice how there is an exponential decay in the spectrogram:
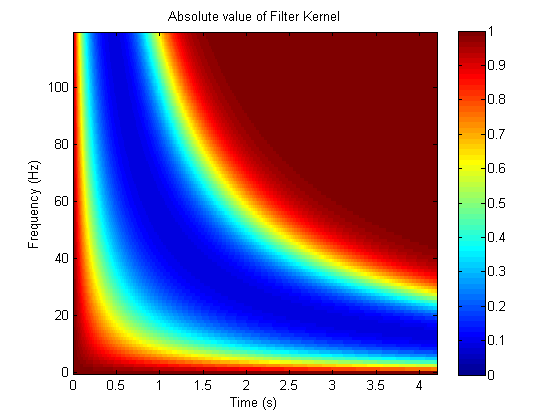
Looking at the absolute value of the forward filter kernel, the exponential decay is very apparent. Notice how some frequencies are decayed more than others. The forward filter kernel has a real and a complex part. The plot below is simply the absolute value of the forward filter kernel. The higher the numerical value of the filter kernel (approaching 1.0), the less attenuation. The lower the numerical value of the filter kernel (approaching 0), the more attenuation.
Here is the mathematical form of the filter kernel $k(\tau, \omega)$ that has been applied by multiplication with the original Gabor-transformed signal:
$k(\tau ,\omega ) = \frac{1}{{\Lambda (\tau ,\omega )}}\exp \left[ {i\int\limits_0^\tau {{{\left( {\frac{\omega }{{{\omega _h}}}} \right)}^{\frac{1}{{\pi \alpha (\tau ')}}}}\omega d\tau '} } \right]$
$\Lambda (\tau ,\omega ) = \frac{{\beta (\tau ,\omega ) + {\sigma ^2}}}{{{\beta ^2}(\tau ,\omega ) + {\sigma ^2}}}$
$\beta (\tau ,\omega ) = \exp \left[ { - \int\limits_0^\tau {\frac{\omega }{{2\alpha (\tau ')}}{{\left( {\frac{\omega }{{{\omega _h}}}} \right)}^{\frac{{ - 1}}{{\pi \alpha (\tau ')}}}}d\tau '} } \right]$
In the above, $\omega, \omega_h, \sigma, \tau$ are all known, and for simplicity I have set the attenuation $\alpha(\tau) = 55$ across the entire signal.
I would like to find the attenuation $\alpha(\tau)$ as a function of time $\tau$, but $\alpha(\tau)$ does not have to be constant, and can change over $\tau$.
I think that the filter kernel is "smooth," whereas the original signal is not.
Is there a way to determine attenuation $\alpha(\tau)$, even in a non-exact way?
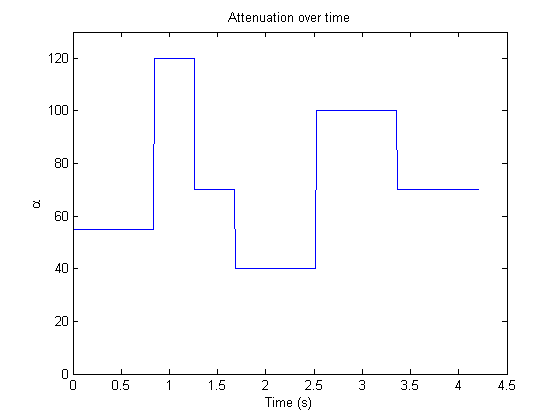
Here I repeat the same experiment for an $\alpha(\tau)$ that changes over time. This is a model of what I would expect $\alpha(\tau, \omega)$ to be (but the curve could also be linear with a negative slope, or something else entirely):
For sake of exposition, here is the original (non-filtered) trace again. This is a signal with no attenuation:
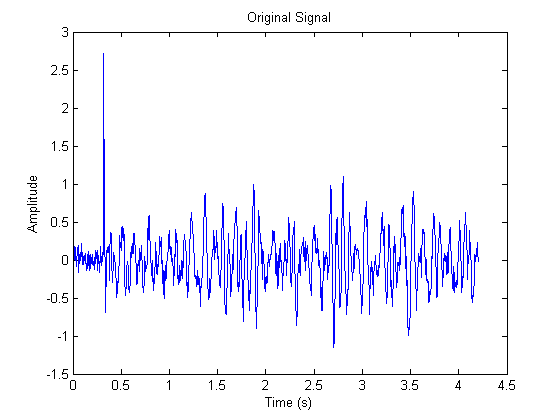
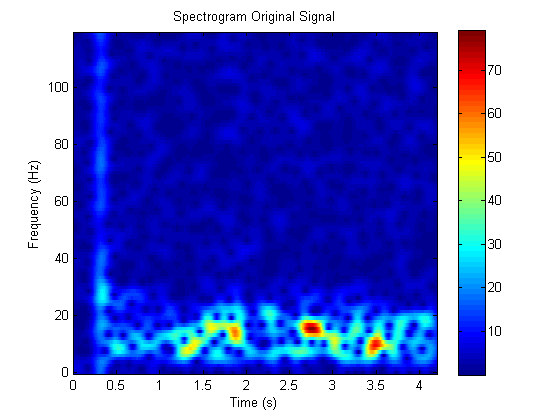
This is a signal with attenuation, where $\alpha(\tau)$ changes over time:
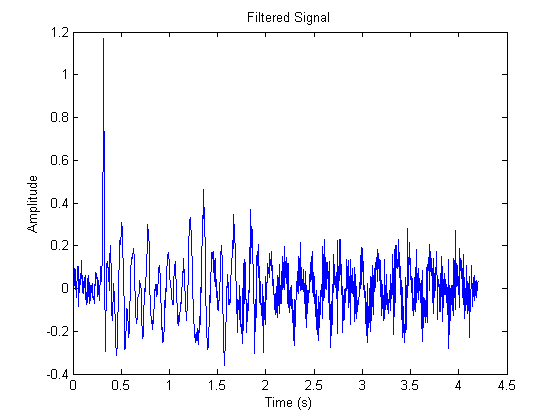
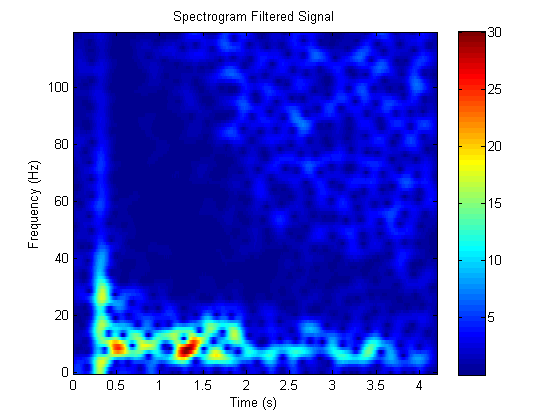
Here is the absolute value of the filter kernel where $\alpha(\tau)$ changes over time. Note that the exponential decay is still present here:
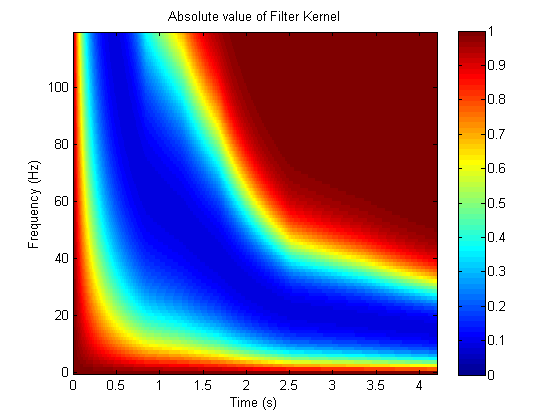
Another perspective
Now I realize that the forward filter in the Gabor transform domain is given by:
$A(\tau, \omega) = A_0(\tau, \omega)k(\tau, \omega)$
So the attenuated trace is $A(\tau, \omega)$, and $A_0(\tau, \omega)$ is the non-attenuated trace, and $k(\tau, \omega)$ is the filter kernel. Given $A(\tau, \omega)$, but not $A_0(\tau, \omega)$, I would like to estimate $\alpha(\tau)$, the attenuation function over time. In this case, I know the numerical form of the filter kernel $k(\tau, \omega)$, but I do not know $\alpha(\tau)$. This is why I wonder if Kalman filtering would be beneficial to use in this type of problem. Perhaps $A_0(\tau, \omega)$ could be treated as noise uncorrelated with the kernel $k(\tau, \omega)$.
Looking at the attenuated spectrograms, I am reminded of image "de-blurring" algorithms. Since the kernel is "smooth" and the original signal $A_0(\tau, \omega)$ is not, it might be possible to somehow separate the $A_0(\tau, \omega)$ from the kernel $k(\tau,\omega)$ using some sort of algorithm.
If I can separate the $A_0(\tau, \omega)$ from the kernel $k(\tau,\omega)$, then I think that can estimate $\alpha(\tau)$.
UPDATE
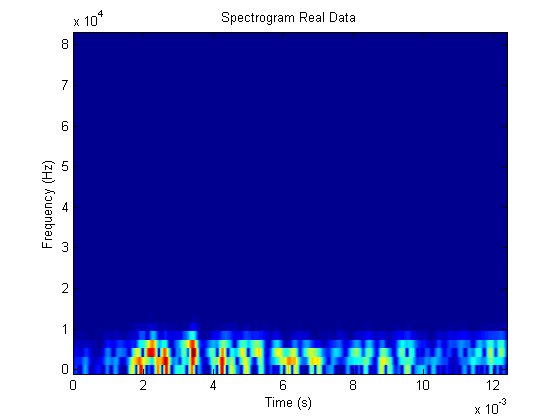
Here is a spectrogram of actual data. The datasets above were synthetic, whereas this spectrogram was collected from an actual experiment.
