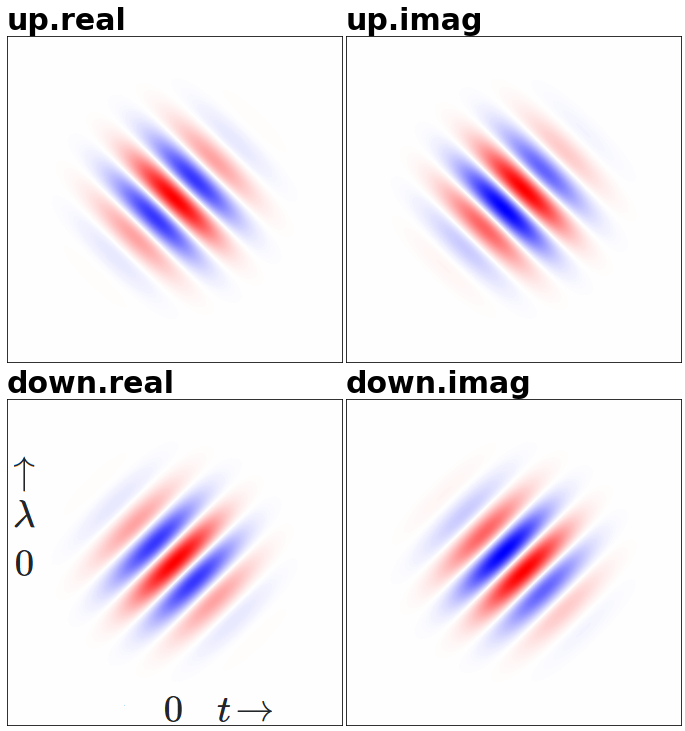
cause it s p i n

Explanation, ground up
When there's complex numbers, there's rotation. Recall, multiplying by $e^{j\theta}$ rotates a number by $\theta$ radians:
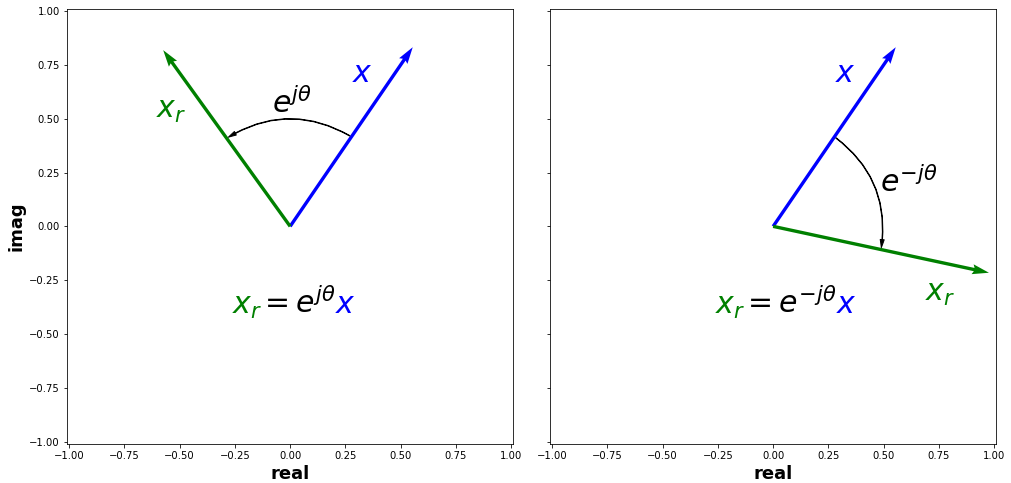
and since $|e^{jX}|=1$ for any (real) $X$, it's a pure rotation, i.e. size won't change. With a general complex number, $a + jb$, there's rotation + rescaling.
A complex sinusoid, $\cos(\omega t) + j \sin(\omega t)$, or $e^{j\omega t}$, can be plotted with real and imaginary parts separately:
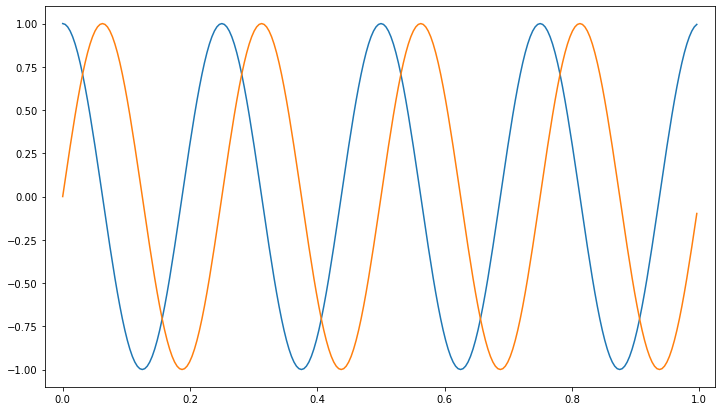
One perspective is, we have a 1D waveform, spatially, with "separate" real and imaginary components. That's what above shows. More often, however, the true perspective is that the waveform traverses the complex plane:
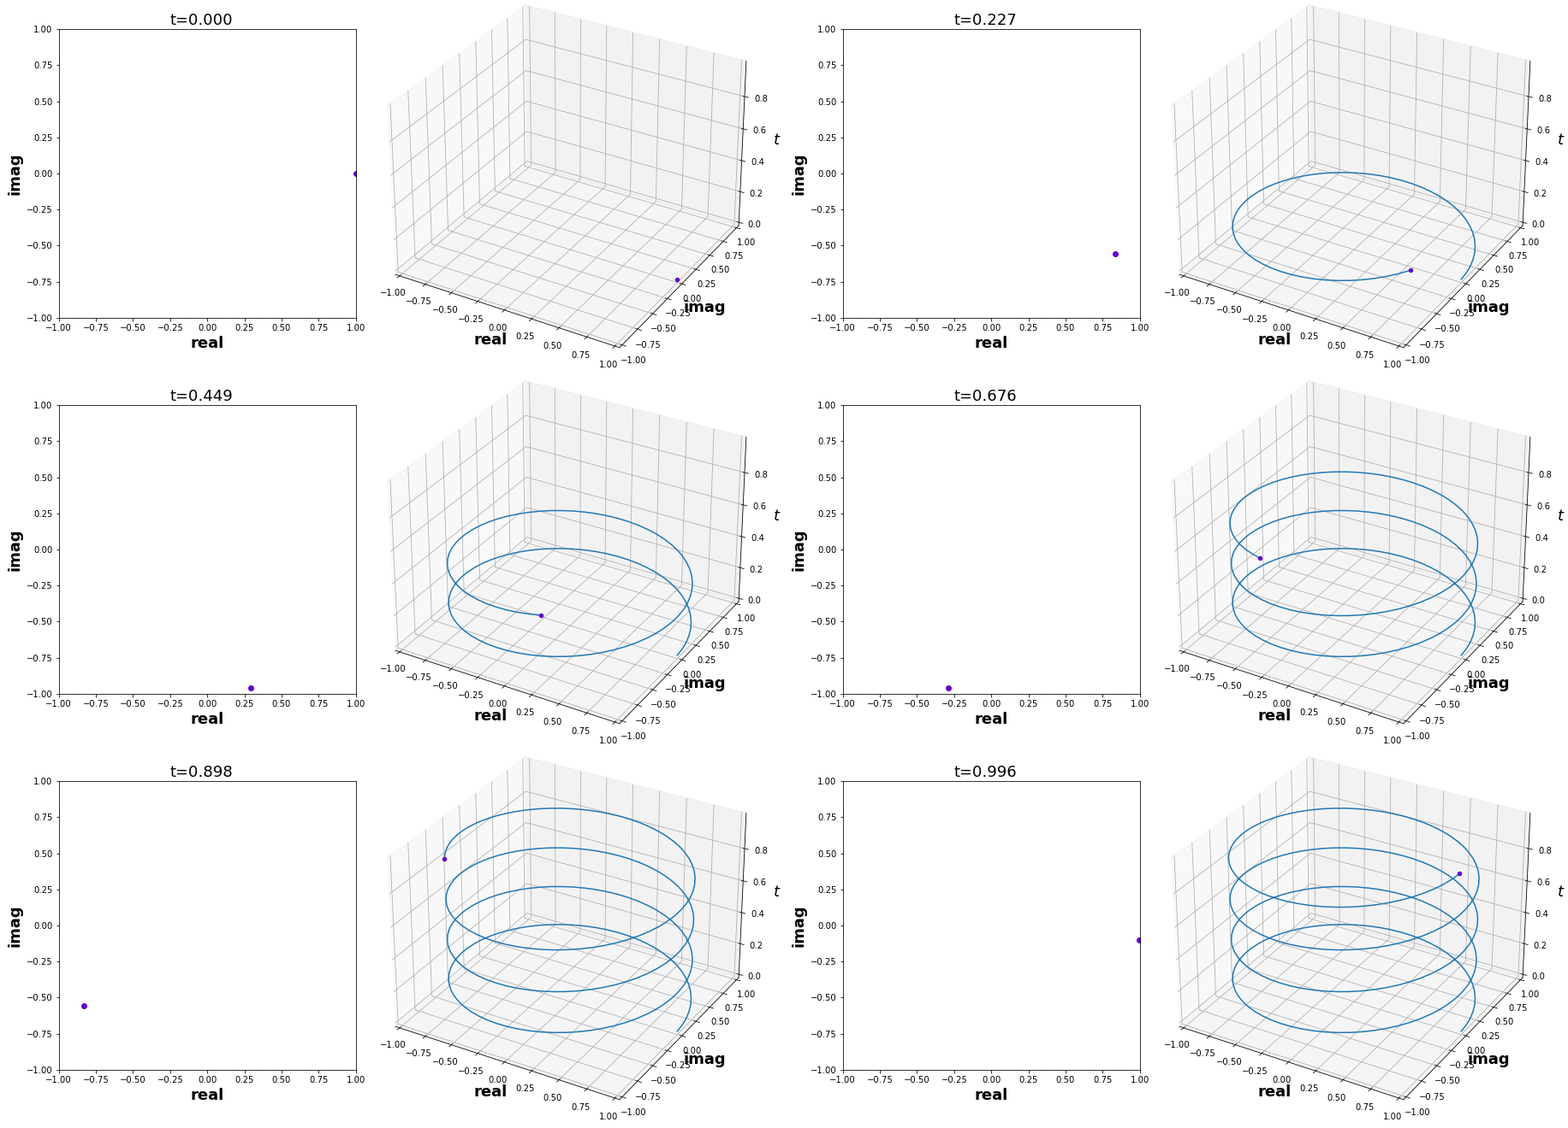
and at each instant, or spatial slice, it's a point in the complex plane. Thus: a 0D point, that traverses a 1D curve, embedded in the 2D complex plane, evolving along the 3rd-D - time.
A Morlet wavelet is approximately a Gauss-windowed sinusoid. That is, it's above, rescaled. Separated view:
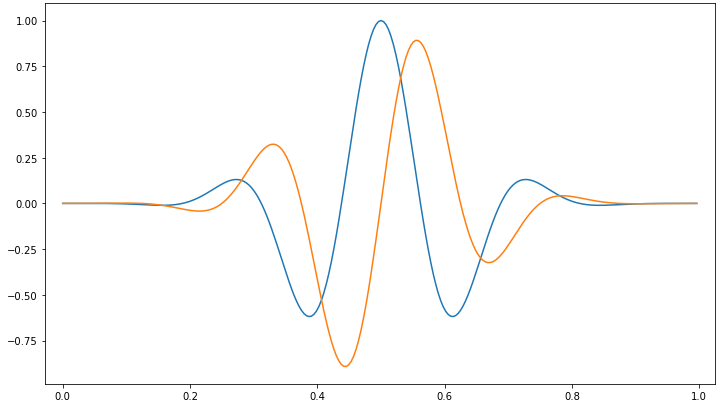
This is exactly what the plots in question show, but for the 2D case. Now, the "true" case - for clarity, shown alongside the pure sinusoid:
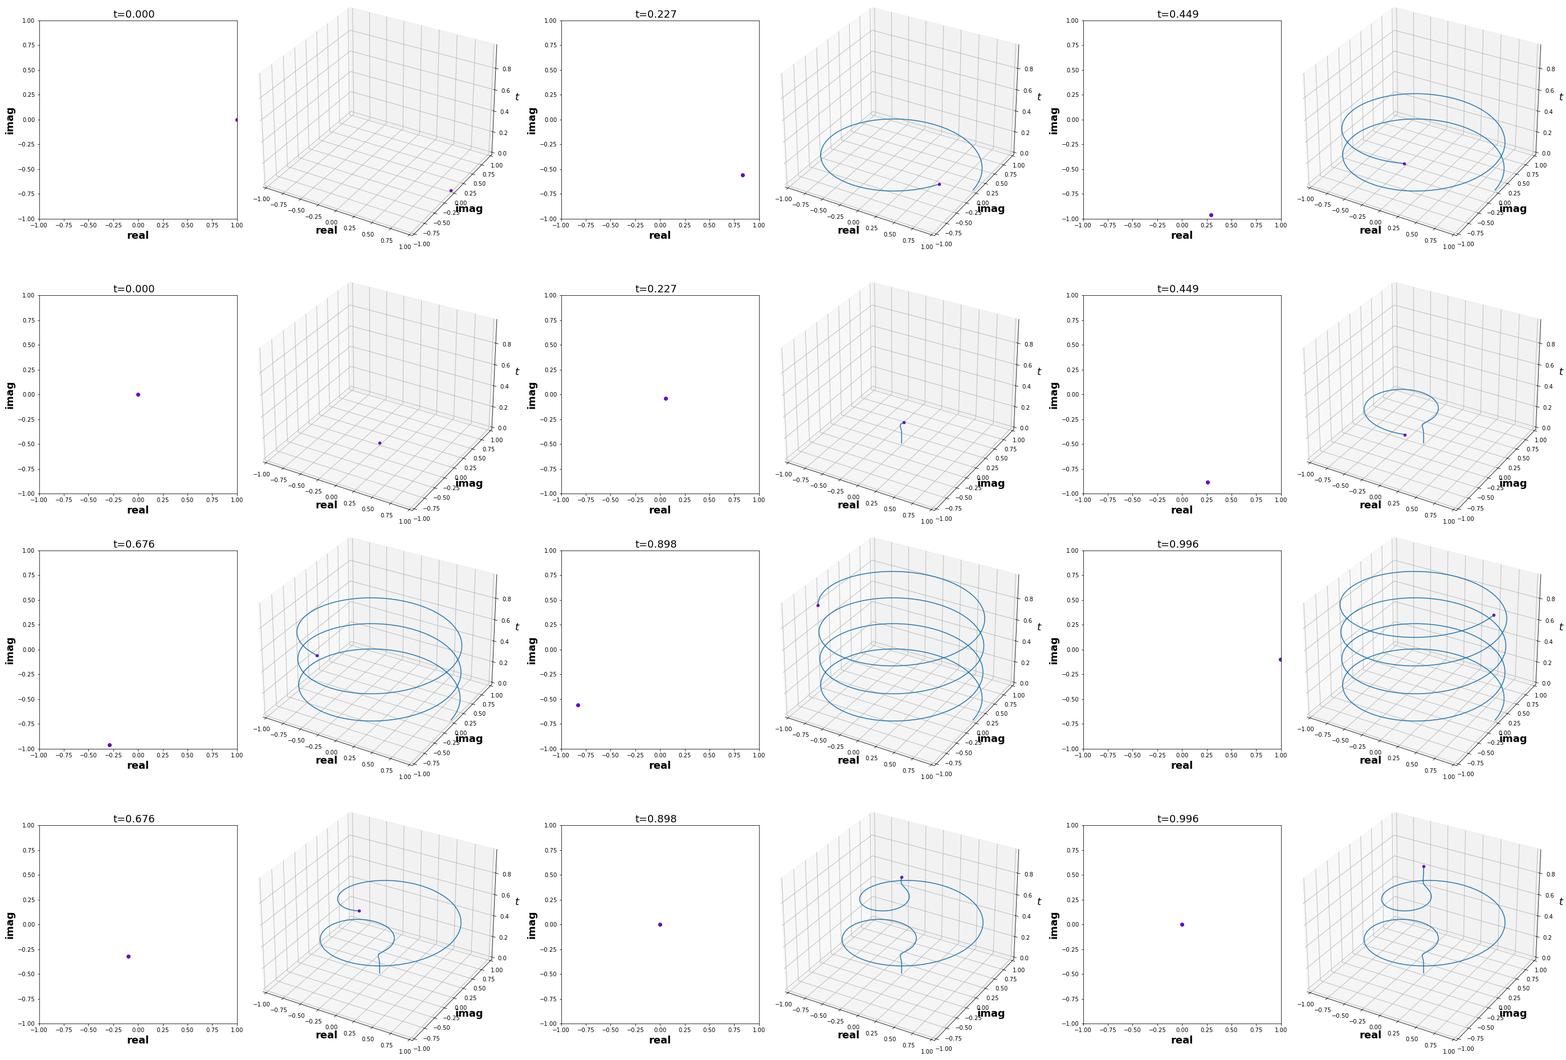
(Note, they don't quite spin perfectly in unison - the subject of center frequency)
2D Morlet
If 1D complex takes 3D to visualize, then 2D complex takes 4D, which spells trouble for us cuboids. If we were flatlanders, we couldn't even do 1D Morlet. We could, however, do the 0D projection of a 1D path onto a 2D plane (left of first GIF).
Our thin cousins light the way: what is the $3D\rightarrow 4D$ equivalent of the $2D\rightarrow 3D$ visuals above? To reiterate, we described the 1D Morlet as:
- a 0D point, that traverses a 1D curve, embedded in the 2D complex plane, evolving along the 3rd-D - time
Then, it should follow, the 2D Morlet is
- a 1D line, that traverses a 2D manifold, embedded in some 3D space, evolving along the 4th-D - time
I.e., "increment all by 1". How to visualize, exactly? Recall,
$$
\Psi(\lambda, t) = \psi(t) \psi(\lambda)
$$
In code, we have Psi.shape == (n_lambdas, n_times). Then, it's just iterating: for each n_time, plot all of n_lambdas (1D, complex). That's 3D, evolving along 4th-D.
Result:
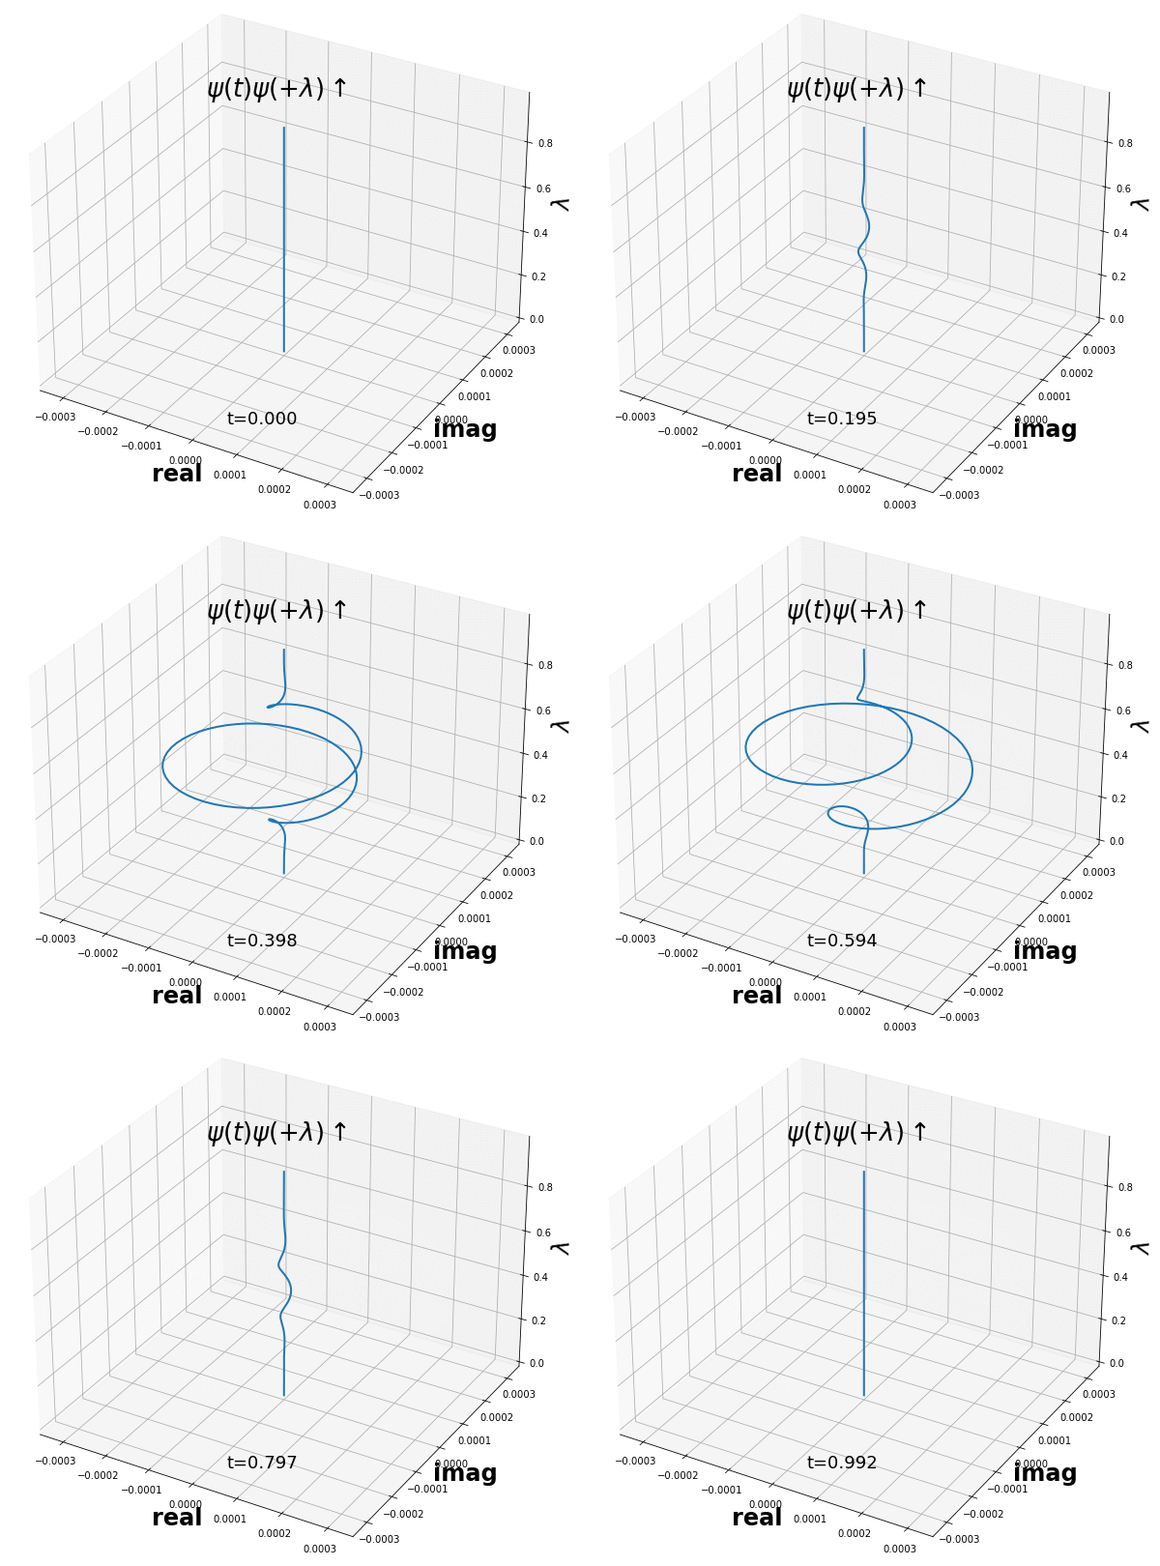
Both pairs:
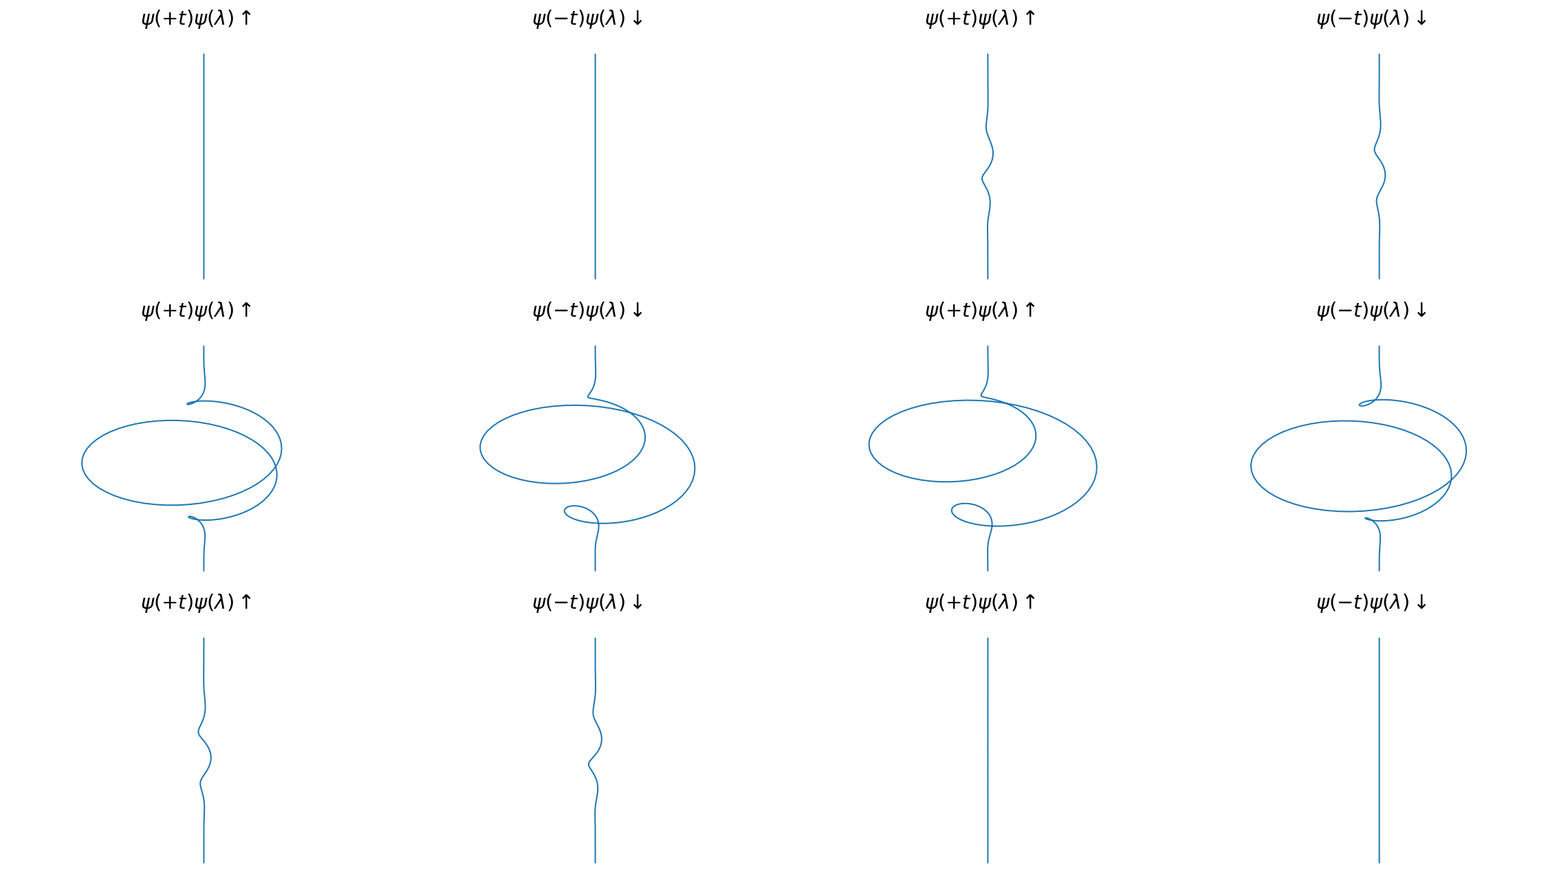
s p i n
in opposite directions!
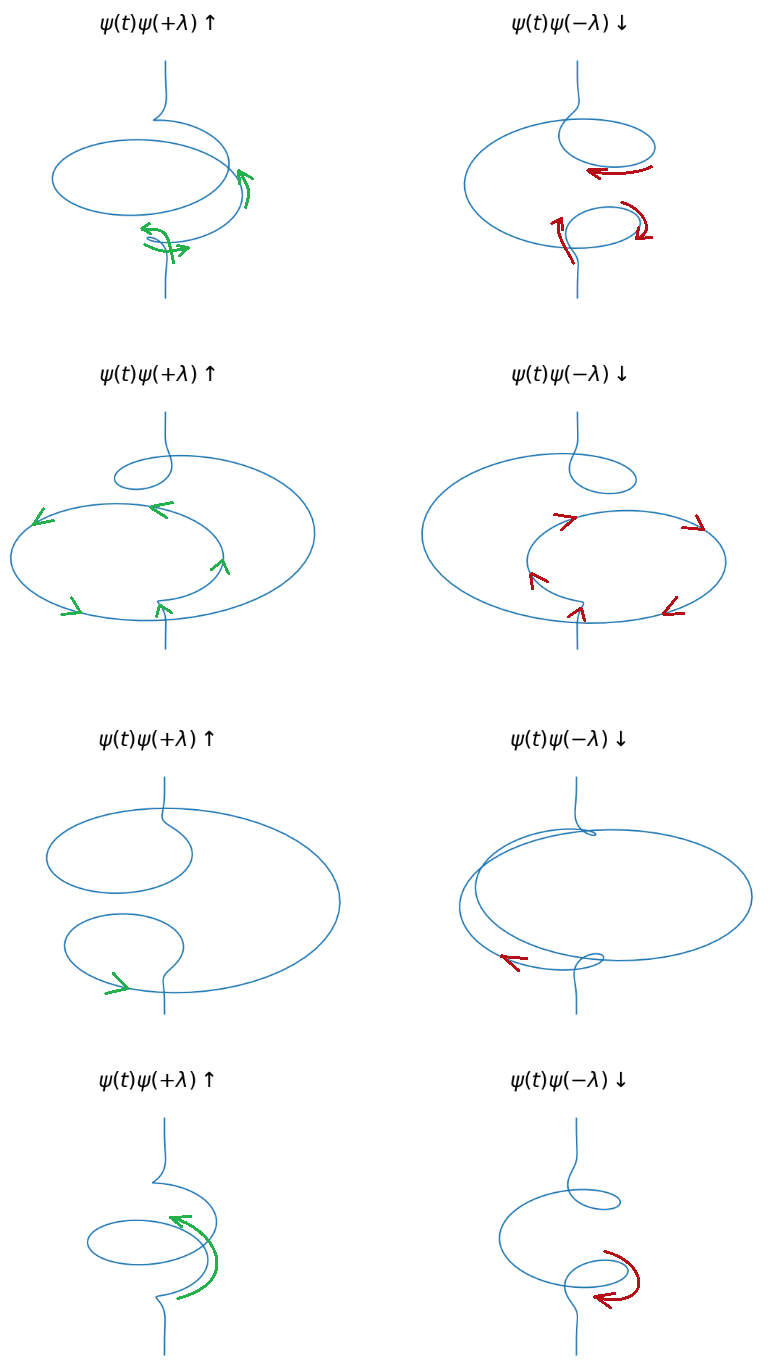
But why "up" or "down"? That's just the right hand rule, as commonly used in physics:

Images source 1, source 2
... wrong spin!
Note it says $\psi(-t) \psi(\lambda)$, rather than $\psi(t) \psi (-\lambda)$. I show what they'd look like if time's sign was flipped, as it's more obvious. Our wavelets in question instead are:
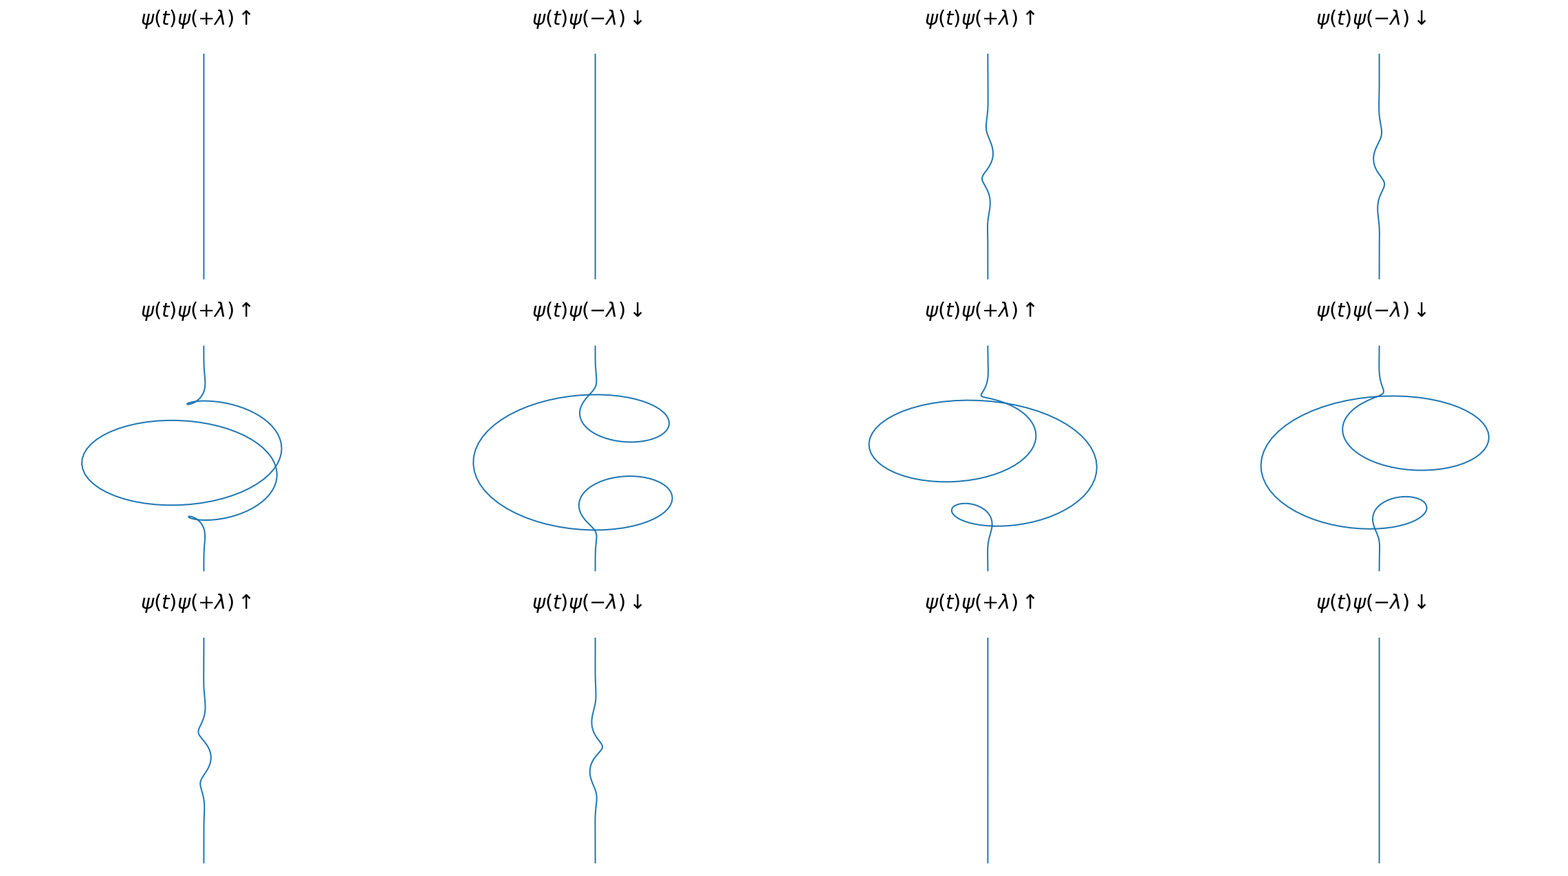
At first glance, we may see they're different but really not tell how. The right-hand distinction is still there, but instead of down being up played in reverse, down is up spatially unrolled in reverse. At different (increasing) time instances:
Bonus: all JTFS filters
In addition to spinned we have lowpass pairs, five in total, each for capturing distinct time-frequency geometry. Together:
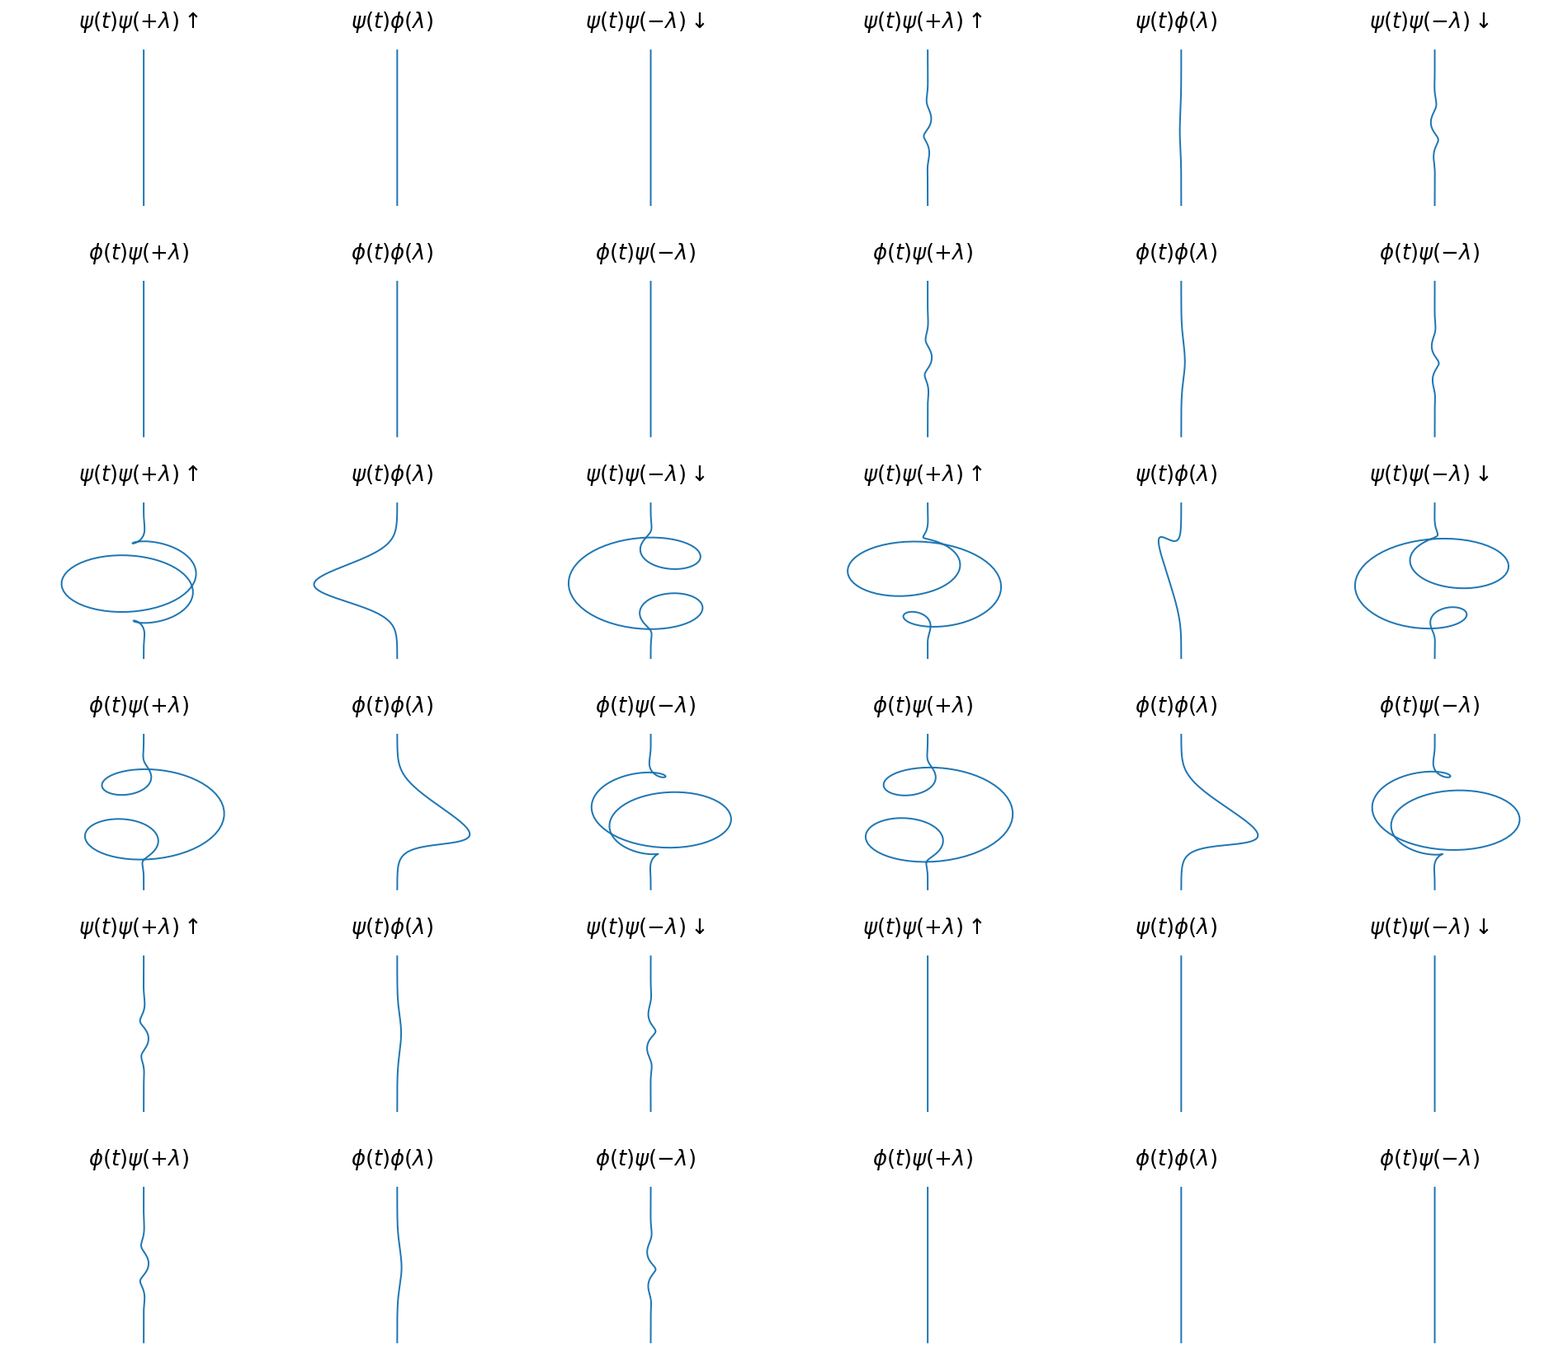
"Five" since they operate on the scalogram, which is always real, then take modulus, hence always $|U_1 * \phi(t)\psi(+\lambda)| = |U_1 * \phi(t)\psi(-\lambda)|$, and one of the pairs is redundant (disclaimer, bad convolution notation used!). But we show all six cause it pretty.
Note, if $U_1$ was complex and we didn't take modulus afterwards, we'd have eleven pairs, with temporal spin $+t$ and $-t$! The only 100% spin-free pair is the joint lowpass, $\phi(t)\phi(\lambda)$.
But does it make sense?
Yes. This is the spin interpretation.
As to whether it is the "true" visual in same sense as the 1D Morlet, it depends. Two competing interpretations:
- Cross-correlation ($\Leftrightarrow$ convolution): the wavelet transform is defined this way. For each timeshift $\tau$, we compute similarities of wavelets $\psi_\lambda(t - \tau)$ with the input, for all $\lambda$ (visual). The convolution kernel is 2D, and there's no such thing as "half a convolution": for every output point, we aggregate over the entirety of the 2D kernel. No "unrolling" or "evolving".
- Impulse response: wavelets are strongly analogous to measurement devices, and there's physiological evidence for the mammalian auditory system doing a sort of wavelet filtering (even, in fact, JTFS: see "Bioplausibility"). Naturally, a physical system's response evolves with time.
Now, we complete our summary formulation and reiterate, for each:
- CC: a 2D time-frequency manifold, pointwise-embedded in a 2D complex plane. Whether the 2D manifold traverses all resulting 4 spatial dimensions, or only a 3D subspace (like 1D Morlet's 2D subspace), I'm unsure.
- IR: a 1D line, that traverses a 2D manifold, embedded in 3D frequency-complex space, evolving along the 4th-D - time
The IR interpretation is the spin interpretation because, the CC interpretation doesn't evolve along anything, and rotation is evolution.
Answer code
To be released soon.
