23
$\begingroup$

I would like to compute a power spectrum in which the frequencies are logarithmically spaced.

In Welch's method there is a trade-off between the frequency resolution of the resulting power spectrum and the number of averages (i.e. error in the result). I would like this trade-off to be dynamic, i.e. do fewer averages for low-frequency points in order to have a finer resolution at low frequency.

Is there a standard way to do this?

I suppose one way would be to initially do pwelch with a very high resolution (low number of averages), and then rebin the resulting spectrum using logarithmic binning.

$\endgroup$
3
  • 2
    $\begingroup$ I usually compute regular spectrum and then simply plot the data on a log scale. I'm not sure it's even possibly without using the modified definition of DFT directly, but I'm interested to see if indeed there are ways. $\endgroup$
    – Phonon
    Commented Aug 29, 2011 at 21:10
  • $\begingroup$ OP's related SO question for those interested. $\endgroup$ Commented Aug 29, 2011 at 23:03
  • $\begingroup$ Another related question on SO: stackoverflow.com/questions/9849233/… $\endgroup$
    – nibot
    Commented Mar 24, 2012 at 11:02

2 Answers 2

11
$\begingroup$

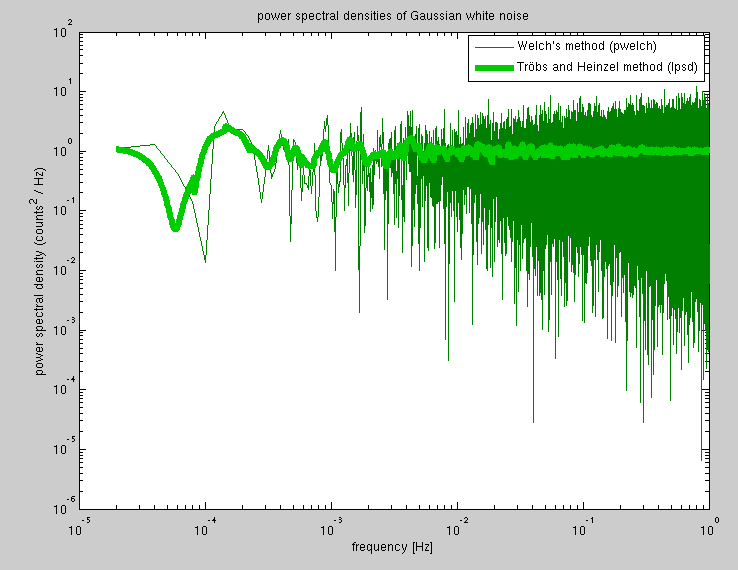
I found a paper that addresses this question directly:

The first few figures in the paper nicely illustrate the problem that this algorithm solves, and the references contain a useful bibliography of other approaches (constant-Q transform, tempered Fourier transform, a survey article, etc).

Their approach is not to re-bin the output of an existing FFT-based power spectrum estimation, but to only compute the discrete Fourier transform at the (logarithmically-spaced) frequencies of interest. For each frequency to be estimated, they basically implement Welch's algorithm, but with a transform length (and hence also, number of averages) specifically chosen for each frequency. The computation of each frequency bin uses the entire time series, but segmented differently. The results have the desirable property that the resolution (bin width) is a smooth function of frequency, and the results can be calibrated as either a power spectral density or a power spectrum.

Matlab implementation here: https://github.com/tobin/lpsd

enter image description here Disclosure: The authors of this paper are at the same institution as me.

$\endgroup$
3
  • 1
    $\begingroup$ What would be the benefits of computing a spectrum in this way? What is the motivation for this method? $\endgroup$
    – Spacey
    Commented Apr 19, 2012 at 22:14
  • 1
    $\begingroup$ It can be faster than computing the power spectrum using the FFT and then rebinning in some circumstances. $\endgroup$
    – nibot
    Commented Jul 24, 2012 at 11:43
  • $\begingroup$ I started a Python implementation: github.com/rudolfbyker/lpsd It still needs testing. Contributions are welcome. $\endgroup$ Commented Apr 30, 2018 at 9:43
1
$\begingroup$

In this case, I would use a least squares method to calculate the frequency of some known list of values. The most common method is the Lomb method. It works quite similar to a FFT or DFT, but it will only calculate the frequency at per-determined frequencies, and it could handle missing data, should that be an issue. The idea is as follows:

  1. Decide a list of frequencies ($w$) over which to calculate, that fit the desired frequency bands you wish to sample at.
  2. Given the frequencies $w$, times at which they were sampled $t_j$, and values $X_j$, find the power of the frequencies as follows:

$P_x(\omega) = \frac{1}{2} \left( \frac { \left[ \sum_j X_j \cos \omega ( t_j - \tau ) \right] ^ 2} { \sum_j \cos^2 \omega ( t_j - \tau ) } + \frac {\left[ \sum_j X_j \sin \omega ( t_j - \tau ) \right] ^ 2} { \sum_j \sin^2 \omega ( t_j - \tau ) } \right)$

Note, this will not scale as nicely as an FFT will, so I would only do this if the number of desired frequencies is much lower than the FFT which would be required to collect all of the data.

Otherwise, one could do an interpolation method or any other re-sampling of an FFT or DFT.

$\endgroup$

Your Answer

By clicking “Post Your Answer”, you agree to our terms of service and acknowledge you have read our privacy policy.

Not the answer you're looking for? Browse other questions tagged or ask your own question.