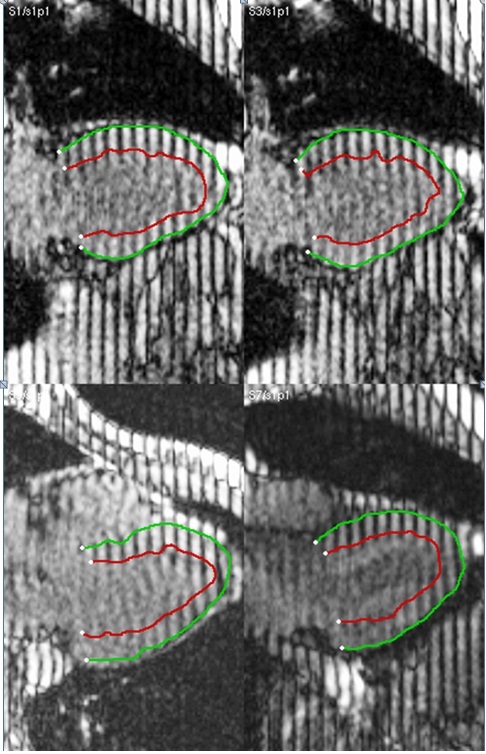
I am doing R&D over the MR Segmentation to draw marker over the Heart MR Dicom Images. My Question is that how I can draw a such marker over the dicom image that show in attach/link image. that Region of Interesr ROI read from the tag or its part of Pixel Processing.
-
$\begingroup$ Just to clarify. From your DICOM images,which are probably from a research paper,it is difficult to tell whether the ROI was read from a DICOM tag or found via Pixel Processing. Access to the image and its metadata would help us to better answer your question. $\endgroup$– NareshCommented Apr 10, 2013 at 10:58
-
$\begingroup$ What is exactly your problem please? Is it 1) how to draw inside the image (cf. beginning of your question) or 2) how to detect interesting parts in the MR image (as the end of your question seems to imply)? You need to be more explicit with your need to get useful help. $\endgroup$– sansuisoCommented Apr 10, 2013 at 11:25
-
$\begingroup$ 1) how to draw inside the image 2) how to detect interesting parts in the MR image these are the question i ask @begining $\endgroup$– user1556866Commented Apr 11, 2013 at 12:38
2 Answers
Typically research papers handling DICOM standard images would probably extract the ROI using pixel processing methods. However, a lot of medical imaging companies like to implement their own DICOM tags(public/private) to keep track of such information for various purposes.
For example, General Electric keeps the following tag enabled on most MR images:
VerticesOfTheRegion found at (0028,9503), which is according to the DICOM standard, a private tag(odd location tags are private)
In short: Its implausible to tell you,how was the ROI extracted without having access to the DICOM metadata of the image in question.
Assuming that you have computed the contour in the first place (through some manual or image processing method), and want to save it in DICOM and restore it for display, you have several options:
in a DICOM Structured Report (SR) as 2D image-relative coordinates in an SCOORD content item with an IMAGE reference
in a DICOM Presentation State (GSPS) as 2D image-relative coordinates in a Graphic Annotation, or as a bitmapped overlay
in a new image that contains a copy of the pixel data plus a bitmapped overlay (e.g., in (60xx,3000))
The SR approach is the most robust, and is what a commercial ultrasound echocardiography product might produce, for ventricular measurements, and also allows you to include the computed numeric values (like stroke volume, etc.)
The GSPS Graphic Annotation approach is more widely supported for display.
The overlay approach is ugly, poorly supported, and best avoided.
If I were building a product that did this, I would probably do all of the above, to maximize the probability that a recipient could handle one of the possibilities, as well as make a "pretty picture" in a secondary capture file with the outlines "burned in".
