0
$\begingroup$

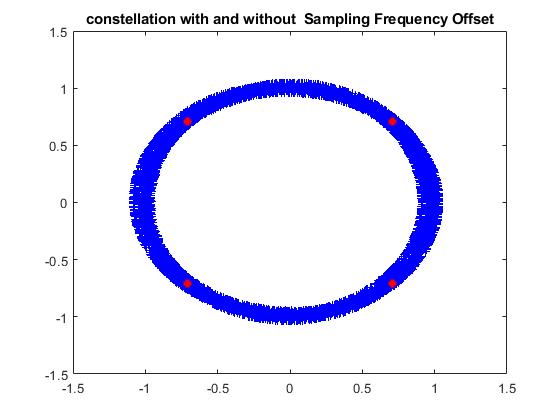
I am trying to emulate the SFO effect for OFDM system, I did it using linear interpolation as shown HERE . That can be explained as if I have the time domain signal $s_n$ representing the output of ifft (let’s ignore the noise and the guard interval), so the SFO can be inserted using linear interpolation. Below is the code I made for that, and the resulted rotated signal without compensating the SFO.

clc; clear all; close all;
n_sym = 10;  % The number of symbols
N = 1024;    % The symbole length 
mod = 4;     %the modulation order 
len= n_sym* log2(mod)*N;  %Lenght of whole data (N * Number of symbol* M)


%This part will generate binary vector as per length entered by user
data=floor(rand(1,log2(mod)*len)+0.5);
%Mapping of binary data
mapper_out = qammod(bi2de(reshape(data,[],log2(mod))), mod,'UnitAveragePower', true);
% Take the iFFt operation after S/P operation 
sn = ifft(reshape(mapper_out,N,[]));

%===== Here using interpolation to add 1 ppm SFO =====
for sy = 1 : size(sn,2)
    S_y = sn(:,sy);       %Taking every symbol separatly
    for nn = 1 : length(S_y)-1 
        X_te(nn) = S_y(nn) + (nn*(S_y(nn+1) - S_y(nn))/1e6);   %Doing linear interpolation with 5ppm
    end 
        X_te2(:,sy) = [S_y(1); X_te.'];                 %[x[1];  x[nn]]
end 
  out = fft(X_te2);  out = out(:);  %P/S

  %===Calculate the BER 
data_rec = qamdemod(out, mod); 
b_rec = reshape(de2bi(data_rec,log2(mod)),[],1).';
[BER_1 Ratio_1] = biterr(b_rec(1:68),data(1:68))
%========== 

figure;plot(real(out),imag(out),'b+');title('constellation with and without  Sampling Frequency Offset'); hold on; 
plot(real(mapper_out),imag(mapper_out),'r+','LineWidth',3); 

enter image description here

The problem is that, when adding an SFO effect of 1 ppm, the signal is completely rotated as shown in the above figure, and the BER cannot be recovered at all as shown in the above code. However, when having 1 ppm SFO, it’s expected to have little bit similar constellation to the ideal signal, and the BER performance is supposed to be almost 0.

Update

Normally, the added SFO effect into the signal $x[n]$ as following:

$y\left [ n \right ] = x\left [ n \right ] + n \times \frac{x\left [ n + 1 \right ] - x\left [ n \right ]}{10^6}$

The dominator is $10^6$ means that 1 ppm is added. Assuming the length of the symbols is $N = 1024$ as I insert the SFO for each symbol alone, so the maximum added SFO will be $1024$ multiplied by the difference between $x[N]$ and $x[N-1]$.

On the other hand, if we can normalize the added SFO by $N$ to have the maximum added SFO 1ppm multiplied by the difference between $x[N]$ and $x[N-1]$, the above equation will be:

$y\left [ n \right ] = x\left [ n \right ] + n \times \frac{x\left [ n + 1 \right ] - x\left [ n \right ]}{N \times 10^6}$

Unfortunately, the rotation is still very big and the signal is completely deteriorated.

$\endgroup$
12
  • $\begingroup$ I am not sure if I am wrong, but why your transitions are always on the circle? Why not crossing zero? It should (if your constellation plot is for interpolated samples) unless you use OQPSK? $\endgroup$
    – user51024
    Commented Jun 23, 2022 at 9:52
  • $\begingroup$ If your interpolated samples are always on the circle and you are not using OQPSK, maybe it is rather a carrier offset frequency that you have $\endgroup$
    – user51024
    Commented Jun 23, 2022 at 9:54
  • $\begingroup$ @gotchi85 do you mean it should be similar to this one here ?? dsp.stackexchange.com/questions/62831/… $\endgroup$
    – Sajjad
    Commented Jun 23, 2022 at 10:39
  • $\begingroup$ Yes that is what I have in mind. The link is for a single carrier modulation. But I am wondering if it shouldn't be the same in OFDM $\endgroup$
    – user51024
    Commented Jun 23, 2022 at 11:51
  • $\begingroup$ @gotchi85 I think you are right however I am trying to check several papers, they show that effect as a circle as shown here in my question. For that, I am also confused !! For example here ieeexplore.ieee.org/stamp/stamp.jsp?tp=&arnumber=9207956 fig. 5 !! $\endgroup$
    – Sajjad
    Commented Jun 23, 2022 at 11:57

1 Answer 1

1
$\begingroup$

The sampling frequency offset will induce a time offset on every symbol that is increasing from symbol to symbol. This results in the rotation as observed.

Frequency is the derivative of phase with respect to time, so a constant frequency offset would result in a linearly increasing phase versus time.

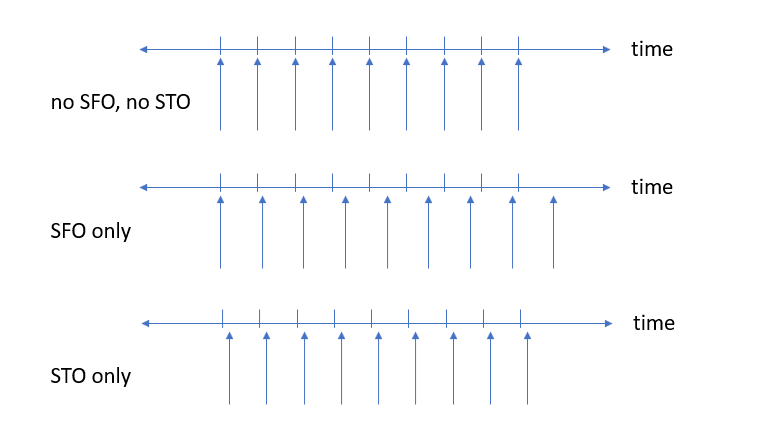
The referenced link provides more detailed formulas as to the actual offsets but the following graphic should provide more intuitive insight into both Sampling Frequency Offset (SFO) and Sampling Time Offset (STO) on one OFDM subcarrier, where below we see the sampling clock versus the ideal sampling location on the time domain.

SFO and STO

What else is interesting which is a direct result of time - frequency duality is if we change the above axis to frequency instead of time. With this we can observe the constellations over frequency at one time instead of above with is at one frequency over time. In this case the results will swap in that if we observed the constellation from sub-carrier to sub-carrier (over frequency) at any given time, the SFT will result in a fixed offset such as the bottom plot and the STO will result in a rotation. This may be the source of confusion for the OP.

$\endgroup$
14
  • $\begingroup$ Thank you for your detailed explanation. But, does that justify that 1 ppm SFO will result complete deterioration in the signal?? because I see some references where they add, for example, 20 ppm SFO however the signal can still be recovered. $\endgroup$
    – Sajjad
    Commented Jun 21, 2022 at 14:49
  • 1
    $\begingroup$ @Sajjad It's not completely clear to me what you are doing in the code without seeing actual data-- Are you doing the interpolation processing on the flattened IFFT of the OFDM symbols-- such that the sampling rate of the time domain waveform is 1024 samples per symbol over 10 symbols? $\endgroup$ Commented Jun 23, 2022 at 3:46
  • 1
    $\begingroup$ @Sajjad It is important that you are doing that as one long continuous sequence, 1024 * 10 plus the additional samples due to the cyclic prefix; that way as you transition from symbol to symbol the offsets will continue to linearly grow as you would expect to see in your receiver with a sampling clock offset. Does that makes sense to you? $\endgroup$ Commented Jun 23, 2022 at 12:30
  • 1
    $\begingroup$ @Sajjad I am starting to see how we might be looking / thinking of different things. I was considering the constellation of just one sub-carrier, and thought you were looking at several successive symbols in time (for that one sub-carrier), which would then be the rotation I described. I may have some time later to make my own example in Python so we can compare notes and your points will then be clearer to me... $\endgroup$ Commented Jun 23, 2022 at 18:18
  • 1
    $\begingroup$ @Sajjad yes I haven’t forgotten you, just got consumed with other things but do intend to look into this further $\endgroup$ Commented Jun 28, 2022 at 13:02

Your Answer

By clicking “Post Your Answer”, you agree to our terms of service and acknowledge you have read our privacy policy.

Not the answer you're looking for? Browse other questions tagged or ask your own question.