4
$\begingroup$

I try to understand that how to use arithmetic coding on images. For this, I code on MATLAB. I tell my understanding for arithmetic coding. If I misunderstood to this algorithm, please correct me. After that, I share to my MATLAB code and its error.

  1. Slice the image using 8*8 macroblock.
  2. Define range using every pixel value and fit 0 with 1.
  3. Low and high range value updated for every pixel value.

I understand like this. How to represent with floating point is a better representation. For example my range 0.32423, how to represent this? Other one question is, how to useful this method better than Huffman?

Here is the my code:

clear all
clc

I = [128 75 72 105 149 169 127 100; ...
     122 84 83 84 146 138 142 139; ... 
     118 98 89 94 136 96 143 188; ...
     122 106 79 115 148 102 127 167; ...
     127 115 106 94 155 124 103 155; ...
     125 115 130 140 170 174 115 136; ...
     127 110 122 163 175 140 119 87; ...
     146 114 127 140 131 142 153 93];

Image = I(:);
prob = zeros(255,1);

comp = arithenco(Image,prob)

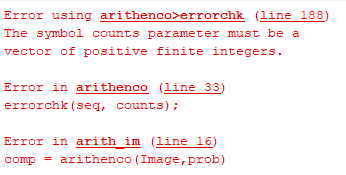
Here is the error:

enter image description here

$\endgroup$
0

1 Answer 1

1
$\begingroup$

First, let's try understand how to work on array for encoding an then move to image and block of images.

By looking at MATLAB's arithenco() function you need to supply a stream of values on the range [1, 2, ..., N] where N is the number of symbols. You also need to supply it a prior about the probability of each symbol.

If you get an image, mI with values on the range {0, 1, ..., 255} and you have no prior about the data you should use its own empiric histogram:

vC = zeros(256, 1); %<! Counts
vS = mI(:) + 1; %<! The stream
for ii = 1:length(vS)
    vC(vS(ii)) =  vC(vS(ii)) + 1; %<! You can do it faster with histcounts()
end

Now you can do something like: vCode = arithenco(vS, vC).

In images, since we have highly correlated pixels within a small window we can use that for better encoding.
This means that instead of using a global vC for the whole image we can use it per small neighborhood.

So you can do the above trick per window of 8x8.
The efficient way to do it on MATLAB, given you have access to Image Processing Toolbox, is using im2col() with the distinct option. Then operate on each column efficiently.

$\endgroup$

Your Answer

By clicking “Post Your Answer”, you agree to our terms of service and acknowledge you have read our privacy policy.

Not the answer you're looking for? Browse other questions tagged or ask your own question.