1
$\begingroup$

Suppose a signal is a superposition of multiple intrinsic-mode-type (IMT) functions, say $$f(t) = \sum_{i=1}^n A_i(t)e^{i\varphi_i(t)} $$ Why is the separation condition of $f(t)$ be $$\forall i,j \quad|\varphi_i^\prime(t) - \varphi_j^\prime(t)| \geq \Delta$$ for some $\Delta >0$.

There is an explanation in Time Frequency Analysis: Theory and Applications by Leon Cohen.

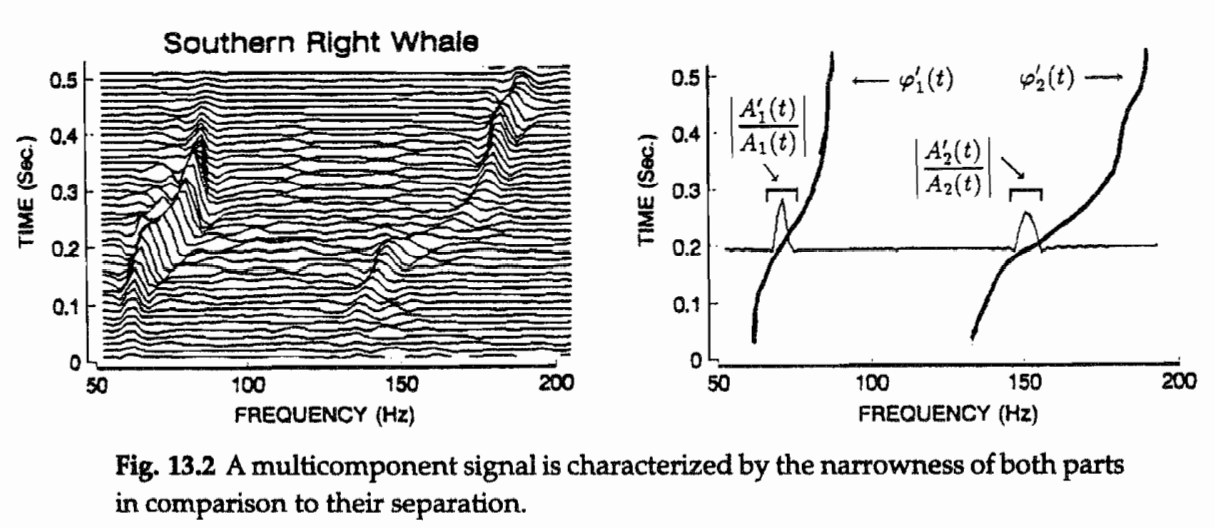
enter image description here

It says that a monocomponent signal will look like a single mountain ridge and at each time the ridge is characterized by the peak. If it is well localized the peak is the instantaneous frequency. Also, the width of the ridge is the conditional standard deviation (actually about twice that), which is the instantaneous bandwidth. So the separation condition is clearly that the instantaneous bandwidth of each parts are much smaller than differences between instantaneous frequency.

But I don't know why the peak of the ridge can represent the instantaneous frequency. Also, is there a rigorous proof of the separation condition ?

$\endgroup$
2
  • $\begingroup$ Can you provide a source or reference for "separation condition" ? It's not a term I'm familiar with and Google comes up mostly empty too. $\endgroup$
    – Hilmar
    Commented Jan 24, 2022 at 15:40
  • $\begingroup$ I read this term form arxiv.org/abs/2112.01857v1 , maybe this property has several names. $\endgroup$ Commented Jan 24, 2022 at 15:54

1 Answer 1

0
$\begingroup$

why the peak of the ridge can represent the instantaneous frequency.

The idea is that the peak in the frequency domain is the "frequency" of the signal. So if the frequency changes, the peak should move to be centered at the new frequency.

Also, is there a rigorous proof of the separation condition ?
Cohen just says:

$$ \left|\frac{A'_1(t)}{A_1(t)}\right| , \left|\frac{A'_2(t)}{A_2(t)}\right| \ll \left| \phi'_2(t) - \phi'_1(t)\right|$$

in equation 13.21.

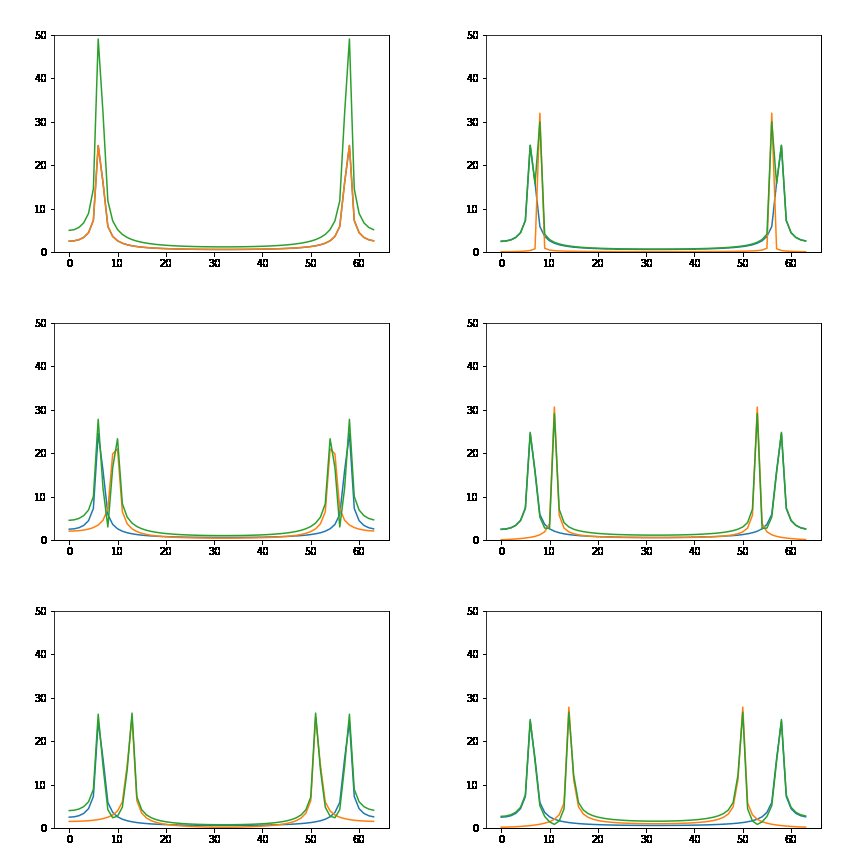
Below is an attempt to visualize this. The blue plot is the absolute value of the FFT of a sinusoid. The orange plot is the same thing, but with the frequency varying. The green plot is the absolute value of the FFT of the sum of the two. As can be seen, when the frequencies are close, it's hard to see the two peaks in the green FFT.

Exactly what the separation needs to be for the peaks to be able to distinguished depends on many factors. We'd need more information about the frequency variations before we can pin that down.

Animation of varying frequencies.

$\endgroup$
3
  • $\begingroup$ In Cohen's book page 85, it says that the instantaneous frequency is an average of frequencies at a particular time. In this sense, I don't know why you can use the peak of the ridge to represent the instantaneous frequency, it's clear that the average of frequencies at a particular time might not be exactly the same as the peak. $\endgroup$ Commented Jan 25, 2022 at 4:58
  • $\begingroup$ @NicolasBourbaki Right: it depends on whether you're after the instantaneous frequency of the whole signal (multiple components) or the instantaneous frequency of each component. I believe the aim is to find the instantaneous frequency of each component, which means you need distance between the peaks in order to resolve them correctly. The instantaneous frequency of the whole multicomponent signal doesn't give you much information, in my opinion. $\endgroup$
    – Peter K.
    Commented Jan 25, 2022 at 12:39
  • $\begingroup$ Yes, but why the instantaneous frequency of each component, i.e. the average of frequencies at a particular time of each component, is the same as the peak? $\endgroup$ Commented Jan 25, 2022 at 15:44

Your Answer

By clicking “Post Your Answer”, you agree to our terms of service and acknowledge you have read our privacy policy.

Not the answer you're looking for? Browse other questions tagged or ask your own question.