2
$\begingroup$

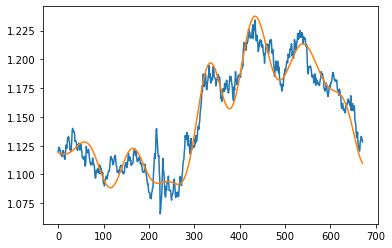
I have performed Hankel Matrix Singular Value Decomposition de-noising to smooth out my univariate time series. It is the close price of EUR/USD exchange rate. Here is a picture:Smoothed Series vs Actual Series
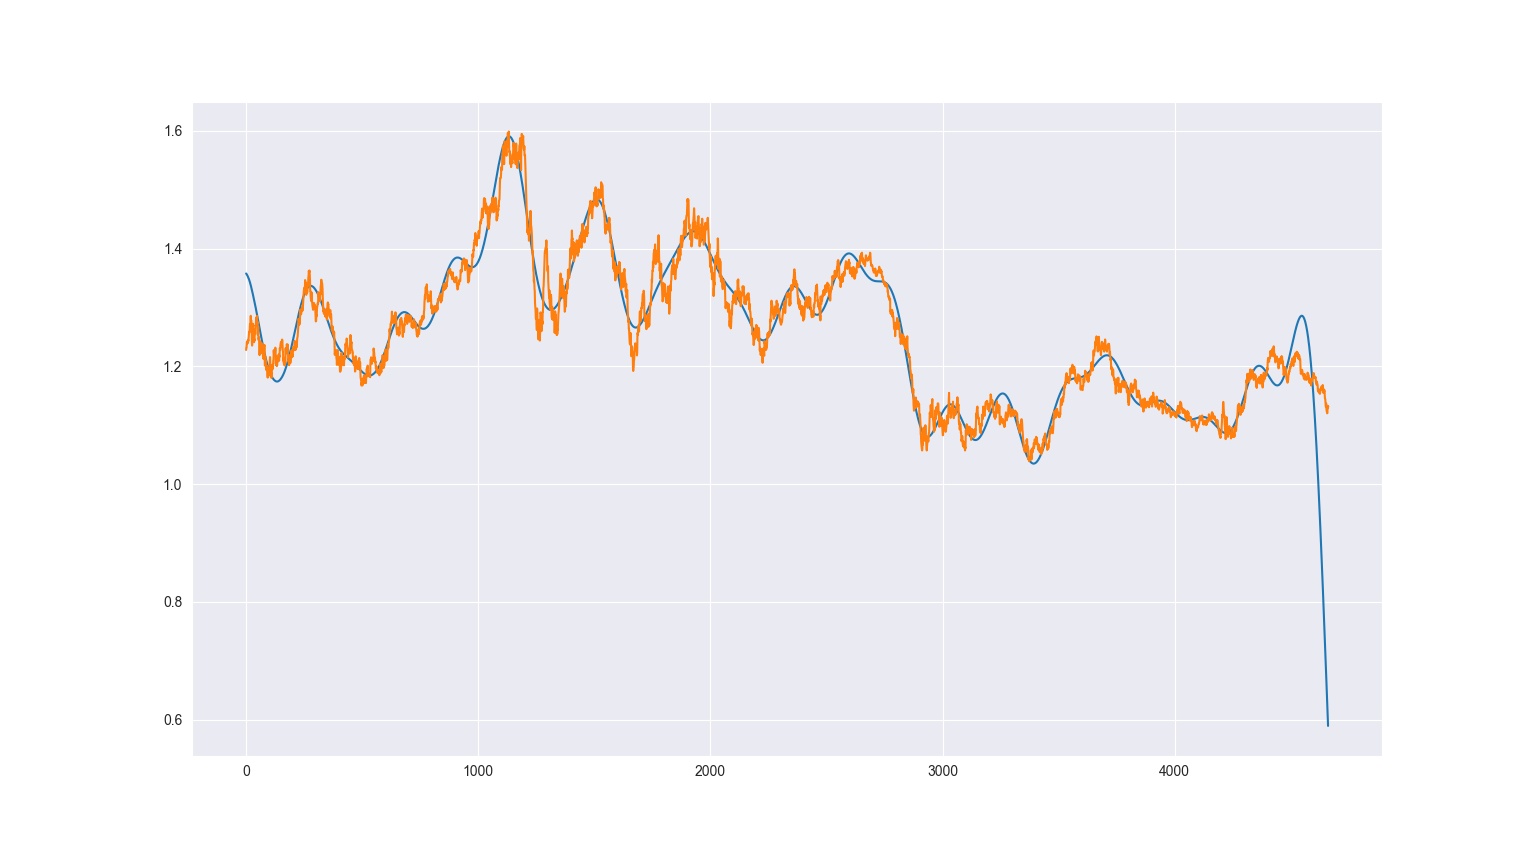
The problem I have is that the end of the data seems erroneous. How can I fix this or is there a better way to denoise my time series such as a Kalman Filter or wavelet transformation. Here is the main part of my Python code:

import numpy as np
import pandas_datareader as pdr
from datetime import datetime 
from scipy.linalg import hankel
import matplotlib.pyplot as plt

symbol = "EURUSD=X"
df = pdr.DataReader(symbol, "yahoo", datetime(2000, 1, 1),
                        datetime.now()).drop(columns=["Adj Close", "Volume"])

hankel_matrix = hankel(df.Close)

U, S, VT = np.linalg.svd(hankel_matrix)

first_k_singulars = 40
S = [0 if i > first_k_singulars else j for i, j in zip(range(len(S)), S)]

close = U @ np.diag(S) @ VT

max_col = len(close[0])
max_row = len(close)
fdiag = [[] for _ in range(max_row + max_col - 1)]

for x in range(max_col):
    for y in range(max_row):
        fdiag[x + y].append(close[y][x])

avg_fdiag = []  
for i, j in zip(fdiag, range(1, len(fdiag)+1)):
    avg_fdiag.append(np.sum(i)/j)

close = avg_fdiag[:len(df)] # take this length of our avg_fdiag as it is a hankel matrix
$\endgroup$
1
  • 2
    $\begingroup$ I think it is better if you share the data (.csv) and explain the objective. There might be a better to do what you want. $\endgroup$
    – Mark
    Commented Dec 4, 2021 at 12:30

1 Answer 1

1
$\begingroup$

A simple approach is to just take the last value of your time series and keep repeating it.

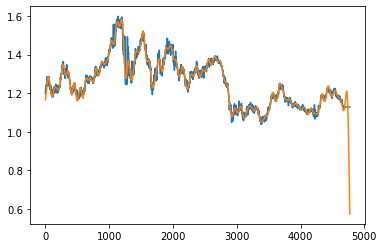
If I repeat the last value 100 times, then I still get the large drop at the end, but the repetition means the end data is not as affected.

Full data

Zooming in on the part that is not repeated:

Zoom to end of data.


Python code

import numpy as np
import pandas_datareader as pdr
from datetime import datetime 
from scipy.linalg import hankel
import matplotlib.pyplot as plt


symbol = "EURUSD=X"
df = pdr.DataReader(symbol, "yahoo", datetime(2000, 1, 1),
                        datetime.now()).drop(columns=["Adj Close", "Volume"])

subset = np.concatenate((df.Close.values, df.Close.values[-1:]*np.ones(100)))
hankel_matrix = hankel(subset)

U, S, VT = np.linalg.svd(hankel_matrix)

first_k_singulars = 90
S = [0 if i > first_k_singulars else j for i, j in zip(range(len(S)), S)]

close = U @ np.diag(S) @ VT

max_col = len(close[0])
max_row = len(close)
fdiag = [[] for _ in range(max_row + max_col - 1)]

for x in range(max_col):
    for y in range(max_row):
        fdiag[x + y].append(close[y][x])

avg_fdiag = []  
for i, j in zip(fdiag, range(1, len(fdiag)+1)):
    avg_fdiag.append(np.sum(i)/j)

close = avg_fdiag[:len(subset)] # take this length of our avg_fdiag as it is a hankel matrix
plt.plot(subset)
plt.plot(close)
$\endgroup$

Your Answer

By clicking “Post Your Answer”, you agree to our terms of service and acknowledge you have read our privacy policy.

Not the answer you're looking for? Browse other questions tagged or ask your own question.