I detail the relationship of frequency offset to ICI below, but if this isn't at all clear, please proceed to the bottom with related links, references and background information that should further help this all make sense.
The difference between this answer and AlexTP's good answer is that he is showing the derived rotation within one OFDM symbol. What I show is that there will also be a rotation in time (from symbol to symbol) and that ultimately our concern will be with a power summation when we would like to know the resultant SNR degradation over several symbols.
Bottom Line
The general case for the total ICI power relative to a subcarrier versus carrier offset in units of subcarrier spacing $k$:
$$n(k) = \sum_n^{N-1} \bigg(\frac{\sin(\pi (n-k))}{N \sin(\pi (n-k)/N)}\bigg)^2$$
With the signal power component reduced according to:
$$s(k)= \bigg(\frac{\sin(\pi k)}{N \sin(\pi k/N)}\bigg)^2$$
From this the SNR due to the ICI from a normalized frequency offset $k$ would be given as:
$$SNR(k) = 10 log_{10}(s(k)/n(k))$$
and Error Vector Magnitude (EVM) given as $EVM = -SNR$ assuming the EVM is computed as being normalized by total constellation power (see this post).
Where:
$N$ is the total number of subcarriers
$k$ is the frequency offset normalized to the subcarrier spacing
This is the expected SNR due to the effects of ICI alone at a frequency offset $k$, where $k$ is the normalized frequency in units of the subcarrier spacing. (For example if we had a subcarrier spacing of 78.125 KHz, and a frequency offset of 100 Hz, $k = 100/78125 = 1.28E-3$).
ICI vs Frequency Offset for OFDM
A simple frequency offset is referred to as Carrier Frequency Offset (CFO) and would create a static rotation for all the subcarriers in one OFDM symbol (the constellation for every subcarrier would be rotated by the same phase relative to the previous OFDM symbol), and from one symbol to the next, each the constellations will rotate in time at the rate of the frequency offset.
The rotation in one symbol can be readily derived from the relationship between a delay in time and linear phase in frequency, and should be consistent with the result of AlexTP's. We can also get this directly from the DFT relationship for delay in the time domain to linear phase in the frequency domain as derived here.
So if we for example if we introduced a CFO of 1 Hz, and watched the constellation for any one subcarrier over several RB's we would observe it rotating at 1 cycle/second (in addition to the modulation itself changing its magnitude and phase).
(Interesting time frequency duality is to note that this is uniquely different from a time offset, in which case each of the subcarriers within an OFDM symbol would rotate relative to each other, but each would remain at the same phase from symbol to symbol -- both properties are used to resolve and correct for such offsets).
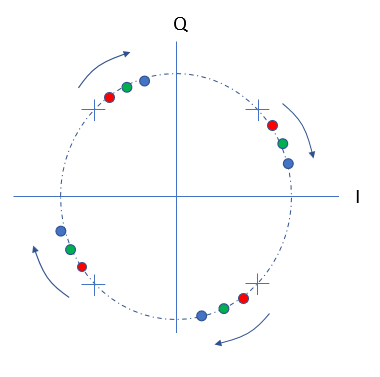
The graphic below is illustrating the concept of rotation in the sub-carrier constellation. In this case the constellation shown is for a QPSK modulation, such that every 2 bits of data are mapped to one of four possible states and used to set the magnitude and phase for a particular sub-carrier as a bin in the DFT. As described above this rotation can be due to either CFO or time delay offset as distinguished by us observing the rotation in time (from one OFDM symbol to the next) for the case of CFO, or in frequency (from one subcarrier to the next within a single OFDM symbol) for the case of time delay offset. So over each observation the constellation is rotating from one of the red locations, to one of the green locations, to one of the four locations.

To understand how this then results in ICI, we will use the magnitude response of each bin in the DFT. We note as further detailed in the references below that each bin of the DFT has a magnitude frequency response given by the Dirichlet Kernel (approaching a Sinc function as the number of DFT bins gets large, and can be described as an "aliased Sinc function"). The Dirichlet Kernel has a magnitude that is given as:
$$|D(\omega)| = \frac{\sin(N\omega/2)}{N \sin(\omega/2)}$$
Where:
$\omega$ is the normalized radian frequency in units of radians/sample with $2\pi$ corresponding to the subcarrier spacing times the total number of bins: $\omega \in [0, 2\pi)$ for $N \in [0, N)$
$N$ is the total number of bins in the DFT (total number of subcarriers).
To express this in units of subcarriers (DFT bins), as a frequency index $k$, the expression would be:
$$k = \frac{\omega N}{2\pi}$$
$$|D(k)| = \frac{\sin(\pi k)}{N \sin(\pi k/N)}$$
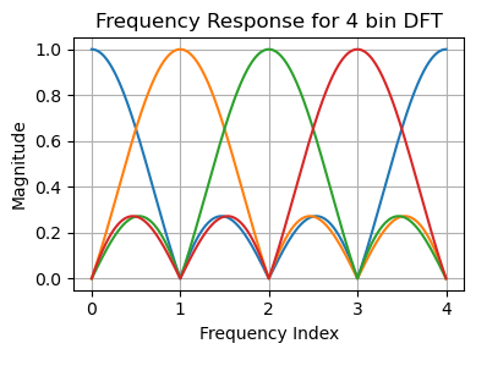
The mechanism for ICI is clear after considering a simple case of a small DFT with 4 bins. The magnitude of the frequency response for all 4 bins in plotted below, as given by the Dirichlet Kernel centered on each bin (note these colors have no association with the colors used above):

Note what we are seeing in the plot above with regards to OFDM: This represents 4 sub-carriers, and the magnitude of the frequency response we would see for each subcarrier using rectangular pulse shaped modulation. Under conditions of modulation with random data, the square of this would be the expected power spectral density for each sub-carrier. When we have perfect synchronization between transmitter and receiver with no Doppler, and no time offsets, then the modulation is aligned such that the frequency index above represents the bin center of each DFT computed in the receiver. We see above that bin 0 would only be responding to the modulation in the "blue" carrier, and bin 1 would only be responding to the modulation in the "orange" carrier, etc... as the response of every other carrier at that particular frequency index is 0.
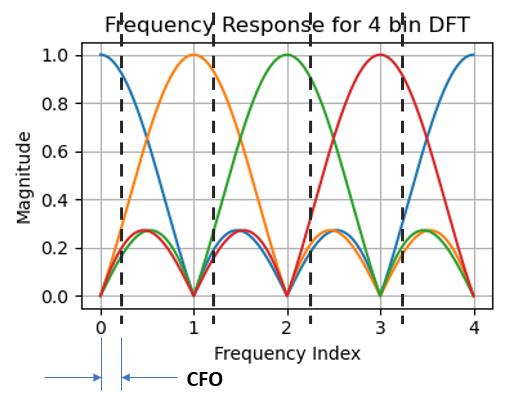
Any small shift in the frequency index, as depicted below, would lead to energy in subcarriers leaking into the demodulation of other sub-carriers, which is specifically ICI.

From this and the formula for the underlying Dirichlet Kernel, we can compute the resulting total ICI as an SNR or EVM degradation. Given the independence of each of the leakage terms from each sub-carrier, the leakage from each will accumulate as a root-sum-square (will add in power). For example, for the case above if we assumed the offset frequency was the equivalent of 0.1 bins, we can compute the total the SNR degradation for the first bin as follows (each term is squared to be a power term, which we can then sum and convert the result to dB using $10Log()$:
$N=4$. The signal component which is specifically at $k=0.1$ with reference to the blue trace will reduce according to:
$$P_{sig} = |D(k)|^2|_{k=0.1} = \bigg(\frac{\sin(\pi 0.1)}{4 \sin(\pi 0.1/4)}\bigg)^2 \approx 0.969$$
The biggest ICI will come from the adjacent subcarrier as given by the orange trace which has an offset from our signal of $k=0.9$:
$$P_{n1} = |D(k)|^2|_{k=0.9} = \bigg(\frac{\sin(\pi .9)}{4 \sin(\pi .9/4)}\bigg)^2 \approx 0.014$$
And similarly the remaining two subcarriers (the green trace and red trace) would each contribute:
$$P_{n2} = |D(k)|^2|_{k=1.9} \approx 0.006$$
$$P_{n3} = |D(k)|^2|_{k=2.9} \approx 0.010$$
The the total SNR in dB for this case would be:
$$SNR = 10log_{10} = \frac{P_{sig}}{P_{n1}+P_{n2}+P_{n3}} = 15.0 \text{ dB}$$
And the EVM would be $-SNR = -15.0$ dB (or in per-cent $10^{-15/20}= 17.8 \text{%}$.
From this we see the general case for the total ICI power relative to a subcarrier versus carrier offset in units of subcarrier spacing $k$:
$$n(k) = \sum_n^{N-1} \bigg(\frac{\sin(\pi (n-k))}{N \sin(\pi (n-k)/N)}\bigg)^2$$
With the signal component reduced according to:
$$s(k)= \bigg(\frac{\sin(\pi k)}{N \sin(\pi k/N)}\bigg)^2$$
As further detailed below, this is specifically the simpler case with a fixed frequency offset, while Doppler Spread involves a "spread" in frequency of many such offsets.
Related Background Details
The following links and details are important to completely understand this answer:
The basics of the DFT (and that the FFT is just an algorithm to solve the DFT: this post can help.
A basic understanding of OFDM and the relationship between the subcarriers and the DFT operations that are used: this post can help.
The terminology of an "OFDM Symbol" is the desired block of user data encoded in a fixed length DFT, with each DFT bin representing a modulation constellation (typically given by QPSK or QAM modulation), such that each bin in the DFT has a magnitude and phase corresponding to the constellation mapped for that symbol duration.
With the FFT sufficiently understood, and how it is used for OFDM as a way to send MANY relatively low bandwidth QPSK/QAM modulations in parallel basically, the next item to really understand is spectral leakage and the "filter bank" view of the DFT. For that I recommend reading this post.


