I am trying to produce a box function filter of a signal in python. I expected to find this functionality in scipy.signal, but I can't find any solutions. What I am trying to do is this.
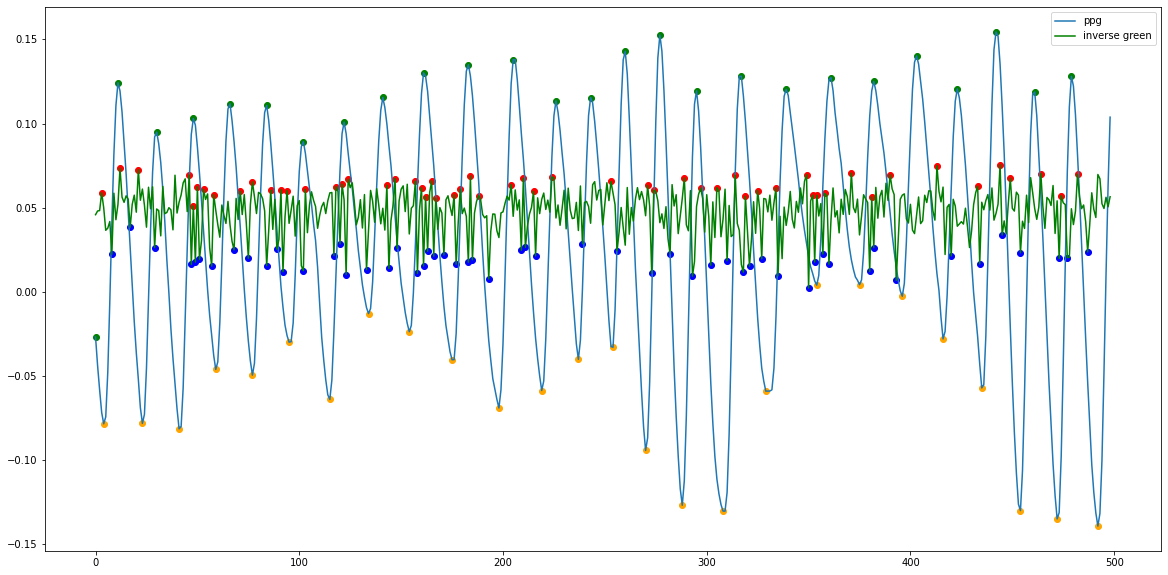
I have 2 signals that look like this:

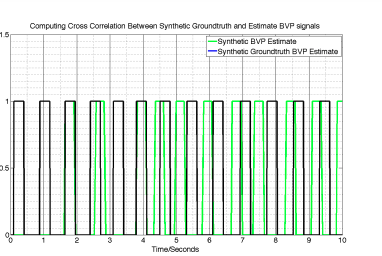
I have the peaks plotted for both of the signals, as you can see. I am trying to create a box function filter so that I can get a result like this:
Here, the two signals are filtered so that that peaks are centered in a constant variable window, lets say 5.
You can also see that signals are normalized so that all maxima are 1 and all minima are 0. Is there any prebuilt solution for this?
EDIT
I'm getting closer to figuring it out, but I keep having trouble. Here is my code so far:
raw_signal = [0.04583763329719659,
 0.04805497846973594,
 0.04829505014640745,
 0.05887341212655883,
 0.05002700454497244,
 0.03658229798020329,
 0.03785355329455342,
 0.041801968109211884,
 0.02233076920674648,
 0.058624423036235385,
 0.04285942959540989,
 0.05198790422582533,
 0.07342396020248998,
 0.05624460427497979,
 0.053187046069069766,
 0.05705776529794093,
 0.055122999401646666,
 0.03843830454570707,
 0.05200852137932088,
 0.057458145238342695,
 0.04733597124868538,
 0.07260882812261116,
 0.05444879316200968,
 0.06107602057454642,
 0.05144282440596726,
 0.03842927653749939,
 0.062157345746527426,
 0.049414162276661955,
 0.06244672513275873,
 0.026325066210119985,
 0.049222807501791976,
 0.048303400035365485,
 0.033270250060013495,
 0.06265669035201427,
 0.0464532491605496,
 0.04716381918115076,
 0.05001360514143016,
 0.04871139499300625,
 0.03684319926833268,
 0.06930899362487253,
 0.04683942206611391,
 0.053229054537951015,
 0.05761049069405999,
 0.06470925254689064,
 0.0671662015520269,
 0.04771008352690842,
 0.06945096065464895,
 0.016286753452732228,
 0.05102230607008096,
 0.01769710761436727,
 0.06242152849154081,
 0.019350205184309743,
 0.03038432296307292,
 0.0609150647505885,
 0.05489945724548306,
 0.05819547914143186,
 0.026275048367097043,
 0.015321600585593842,
 0.05769180825154763,
 0.04853383834415581,
 0.04002726600447204,
 0.03246579690312501,
 0.05159124229976442,
 0.04558678156172391,
 0.04065268985868897,
 0.05376688459364232,
 0.03983559690823313,
 0.02996508228534367,
 0.024953327010734938,
 0.05553271730605047,
 0.04297505620343145,
 0.05980710957373958,
 0.04593995363393333,
 0.05778656013717409,
 0.040827999691828154,
 0.019963644081144594,
 0.051858118604286574,
 0.06540824360854458,
 0.05649360937240999,
 0.04654800250136759,
 0.05910070285608526,
 0.058185853049508296,
 0.05541932878259104,
 0.04814119565708097,
 0.015593319767504,
 0.0365044306818163,
 0.06034806101524737,
 0.037100095869391225,
 0.054988950068945996,
 0.02537936052249279,
 0.031081240376806818,
 0.06072348878660705,
 0.011991354040219449,
 0.044582271584658884,
 0.060200185907888226,
 0.040700219324207865,
 0.04851865196542349,
 0.056848127496778034,
 0.03311677974124905,
 0.05129374585521873]
def make_chunks(lst, n):
    """Yield successive n-sized chunks from lst."""
    chunks = []
    for i in range(0, len(lst), n):
        chunks.append(lst[i:i + n])

    return chunks


def get_local_max_min(windowed_chunks):

    max_coords = []
    min_coords = []
    original_idx = 0

    for i in windowed_chunks:
        local_maxima = max(i)
        local_minima = min(i)
        local_max_idx = i.index(local_maxima) + original_idx
        local_min_idx = i.index(local_minima) + original_idx
        local_max_coords = [local_max_idx, local_maxima]
        local_min_coords = [local_min_idx, local_minima]
        max_coords.append(local_max_coords)
        min_coords.append(local_min_coords)
        original_idx += window

    return max_coords, min_coords


def join_and_sort_coords(max_coords, min_coords):

    coord_lst = max_coords + min_coords
    coord_lst = sorted(coord_lst, key=lambda x: x[0])

    return coord_lst


def box_filter(coord_list, box_filter_span):

    box_filter_list = []
    for i in coord_list:
        mod_val = ([i[1]]*box_filter_span)
        box_filter_list.append(mod_val)

    box_filter_list = [item for sublist in box_filter_list for item in sublist]

    return box_filter_list


def plot_signals(raw_signal, max_coords, min_coords, box_filter_list):

    plt.figure(figsize=(20,10))
#     plt.plot(raw_signal)
    plt.plot(box_filter_list)
    for x,y in max_coords:
        plt.plot(x,y, color='red', marker = 'o')
    for x,y in min_coords:
        plt.plot(x,y, color='green', marker = 'o')


window = 10
box_filter_span = 5
windowed_chunks = make_chunks(raw_signal, window)
max_coords, min_coords = get_local_max_min(windowed_chunks)
coord_list = join_and_sort_coords(max_coords, min_coords)
box_filter_list = box_filter(coord_list, box_filter_span)
plot_signals(raw_signal, max_coords, min_coords, box_filter_list)
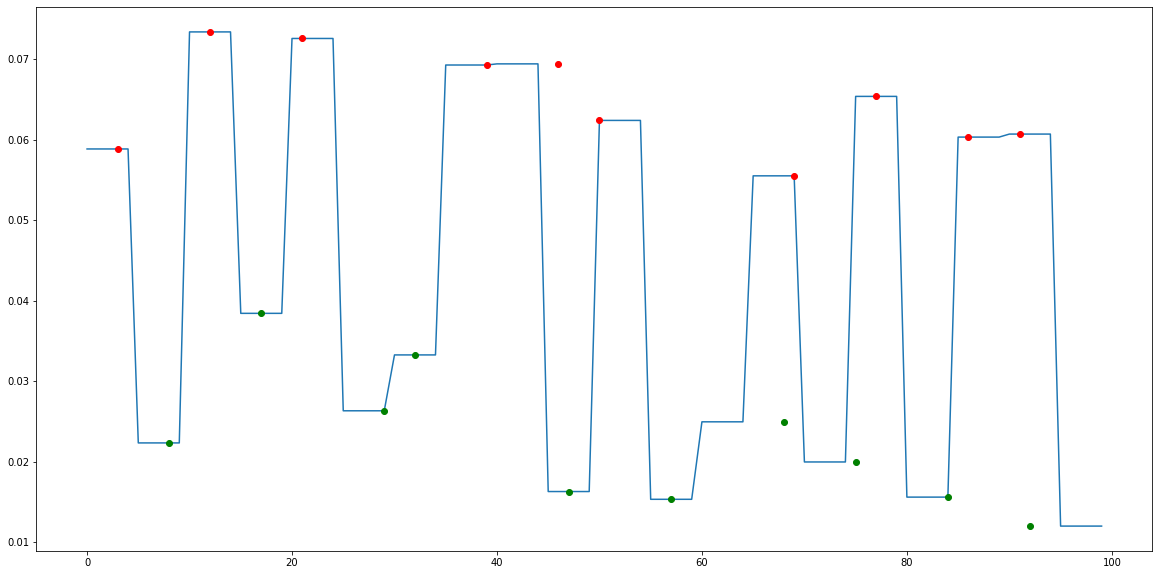
Which produces this:
This is wrong because it should alternate max-min-max-min and so on, like in the second plot. You can see my plot breaking at the 3rd minima.


