1
$\begingroup$

I believe I have found a (new?) secret in FEZ's soundtrack, but my visualizer isn't clear enough to capture it 100%.

In FEZ's soundtrack (by Disasterpeace), there are "secrets"- stuff like encoded images. These exist in almost all of the songs, even some of the more atmospheric ones. The game is about a shift in dimensional perspective, like from 2D to 3D and back, and the soundtrack represents that same shift beautifully when you pull up a spectrogram.

Every note is deliberate, in either creating an emotion or image, or even just setting up the rest of the song. White/blurry noise is used to create a sense of space, while mirrored sounds (high-low frequency, like a guitar playing the opposite notes, ascending instead of descending) give a sense of either spookiness or The Ancient Ones (the space squids that mastered the fourth dimension or whatever). Every. Single. Track... has either a secret, is atmospheric for the hell of it, every note deliberate. Disasterpeace did a good job on not making any "throwaway" tracks.

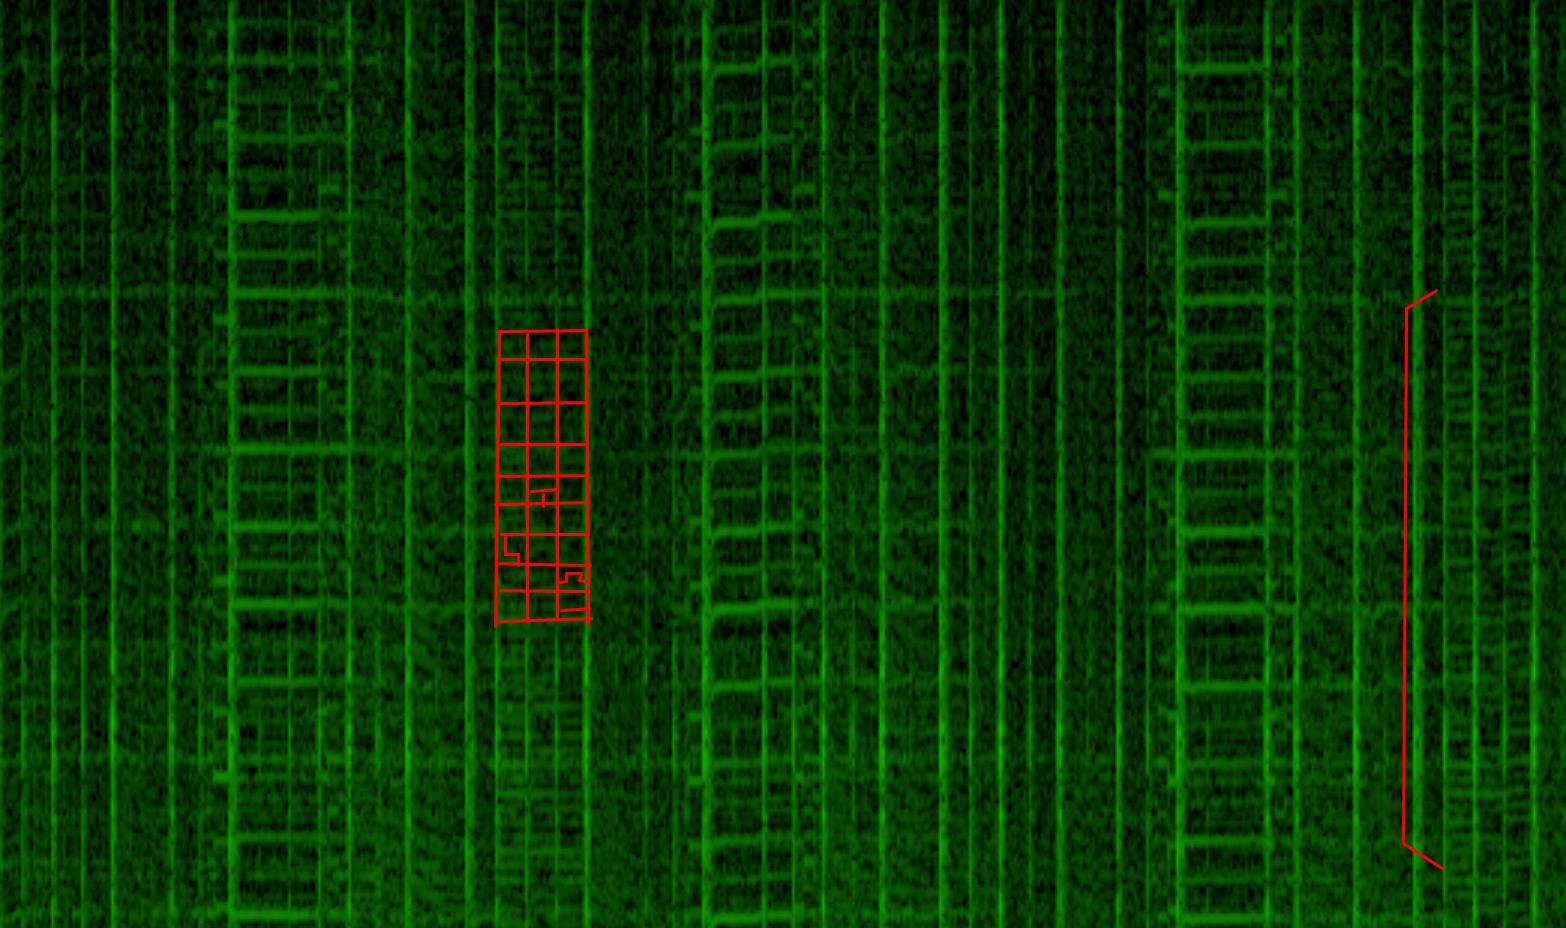
So while messing with setting up a spectrogram for streaming, I remembered the FEZ soundtrack existed, and had a listen to my favorites... and saw something regular. Very regular. HORIZONTALLY, not just the usual vertical of drums or shifting horizontal lines/planes of synths. Tweaking the settings, I got the best screencap I possibly could, but as you can plainly see without the context of the game, it's too blurry to properly see anything besides the telltale grid and tiny lines within, juuuust clear enough to recognize a few, but not enough to read at all.

The song is Sync by Disasterpeace.

This is the original capture: original capture

This is the same image but cropped with the context on top:

Cropped image

Original Upload - Imgur

This is the FEZ alphabet (for reference), in case you don't know what you're (possibly) looking at:

FEZ Alphabet

$\endgroup$
5
  • 2
    $\begingroup$ Very interesting premise, but I'm not sure what you're asking. It seems you ask for recommendations for software to improve the visual representation of the songs, which is off-topic here. $\endgroup$
    – Joachim
    Commented Sep 13, 2020 at 7:29
  • 1
    $\begingroup$ It is based on getting a secret in the soundtrack, very on-topic when talking about FEZ $\endgroup$
    – Skye Mors
    Commented Sep 13, 2020 at 18:23
  • $\begingroup$ You should change your post into a concrete question with an explicit answer in order for us to help you with your problem. You should ask for us to help solve the original problem. Example: "Is there/What is the hidden text in the song Sync?". You can then go on and motivate. Explain how you did your homework (I.e. how you made the spectogram, and so forth). An expert may be able to improve the results, or there may already be an answer out there; someone has documented the secret. $\endgroup$
    – aphid
    Commented Sep 15, 2020 at 10:40
  • $\begingroup$ I’m voting to close this question because it's about audio processing, not video games. $\endgroup$
    – Wrigglenite
    Commented Sep 16, 2020 at 10:37
  • 1
    $\begingroup$ Hi @SkyeMors - welcome to the site! Even though this is technically 'about' FEZ, it's not really something we can answer. It's not that we don't want to help, but our community is more focused on the gameplay & story side of gaming - we don't really have the expertise to be messing with spectrograms or audio files. You would probably get better answers from communities who specialise in this sort of thing $\endgroup$
    – Robotnik
    Commented Sep 17, 2020 at 4:10

1 Answer 1

1
$\begingroup$

A few pointers to help you produce more detailed results:

First, you may want to read about a phenomenon called Pareidolia. By tweaking and tuning parameters, you may be simply creating results through coincidence.

There is no such thing as the spectogram.

There is such a thing as a spectogram.

I've looked at some of the results already found that have been posted online, but none actually talk about the specifics of the spectogram used. This makes those results hard to reproduce (outside of running the exact same program with default settings). Why?

Spectograms have many, many parameters. Some explanation below:


Windowing function

First, there is the windowing function, which is technically any function taken from a function space (this stuff gets very complicated). Typically it's taken to be continuous or at least semi-continuous (a finite number of discontinuities).

Theoretically, this kind of space is of the order aleph-3, although practically we're limited by the resolution of the computer, or, the total resolution is N floating-point values big. Typically these have a 53-bit mantissa and are between zero and one, so we're already looking at 53KB of parameters for a 1024 FFT size spectogram.

Window size

This is typically taken to be a multiple of the FFT size, usually W = N. Ideally, at least one full FFT size is inside the window size. Complicated mathematical expressions can identify the resolution of a spectogram, which depends on this parameter.

Window overlap

In order to improve time resolution somewhat, when using non-rectangular windows windows are usually chosen to overlap to reduce spectral leakage losses. High window overlap factors tend to smear out/deform the image. Typically chosen to be 0.5 with most standard windows as that satisfies COLA.

FFT size

Changing the FFT resolution can change the shape and image of the spectogram through rounding effects and also has an effect on the time-resolution capability of the spectogram. You could compare it to the Heisenberg principle: increasing the sample count improves frequency resolution, especially at low frequencies, but reduces time resolution.

Must be a power of two for the traditional FFT algorithm to run quickly enough.

Has an impact on the speed of the visualization. Older programs tend to run with lower FFT sizes to enable real-time visualizations on slower computers. FFTs scale with O(N log N). See here.

Sampling frequency

May not match the recording frequency, in which case the audio is resampled before analyzing. Iff so, then the resampling method used can also impact the result.

Base frequency

Typically not directly configurable (typically the user is asked to select min/max frequency shown in the resulting image), the base frequency of the FFT is equal to fs/N, or the sampling frequency

Filters, transformations, etc.

Post- and pre-processing is typically used to improve the output quality for visualizers. Typically done to remove noise, compression artifacts and the like, they can corrupt hidden images, which are often of very low volume and may be caught by a noise filter.

Image width in px

Finally, the chosen image width and, iff different from the size of the FFT output, the resize filter can make an image fuzzier in quality. Ideally the image width is equal to the FFT output, though, if this is too big, the FFT output is an integer multiple of the image width. Take care to convert the image if needed with an integer ratio as well to reduce artifacting, and to use a lossless format.

$\endgroup$

Your Answer

By clicking “Post Your Answer”, you agree to our terms of service and acknowledge you have read our privacy policy.