The maximum frequency for a real waveform is $F_s/2$, while the maximum frequency for a complex waveform is $F_s$. The DFT is a transformation of N samples in time to N samples in frequency, with bins numbers $0$ to $N-1$, with bin $0$ representing "DC", and bin $N-1$ representing 1 bin less than the sampling rate.
Complex signals are resented as phasors rotating in time in either a counterclockwise ($e^{j\omega t}$) or clockwise ($e^{-j\omega t}$) direction representing positive and negative frequencies specifically. Know that each bin in the DFT represents a single complex frequency ($e^{j\omega t}$), and given Euler's Identity you need two complex frequencies to represent a sinusoidal tone:
$$2\cos(\omega t) = e^{j\omega t} + e^{-j\omega t}$$
Hence the reason why you only need $F_s/2$ for real waveforms since the second tone is redundant (always the complex conjugate for real signals).
Also importantly, the DFT is cyclical as it is a sampled system, no different than how aliasing occurs when we use an A/D converter.
The simplest way to see all of this is to consider a bicycle wheel representing a complex tone, and a strobe light as our sampling clock.
The wheel can spin counter-clockwise or clock-wise, and we will refer to counter-clockwise as a negative frequency, and clockwise as a positive frequency.
If the wheel is spinning 2 cycles per second clockwise, and our strobelight is going at 10 cycles per second, we will witness the 2 cycles per second spin rate. However if our wheel is spinning 12 cycles per second clockwise, it will appear just as if it is spinning 2 cycles per second. If our wheel was spinning 10 cylces per second, it would appear as it is not spinning at all (DC!).
This is just like the DFT, and why bin N-1 is the highest frequency. The next bin N (if we had more bins) would be the sampling frequency itself and would be no different than bin 0. This is the cyclical nature of the DFT, and how for complex signals we can map them either from $-F_s/2$ to $+F_s/2$ or as is done in the DFT from $0$ to $F_s$. (since it is cyclical either can be a unique span).
So we have N bins with each frequency as $0/F_s, 1/F_s, 2/Fs ... (N-1)/F_s$, we see that the bin width is $F_s/N$.
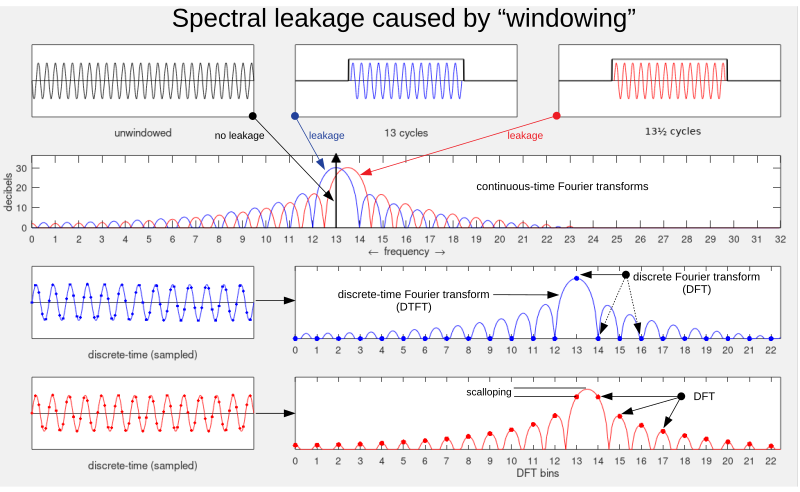
Ultimately and more universally a time sample of duration $T$ has a frequency resolution of $1/T$ (Time Frequency Duality). So if our sampling rate is $F_s$ samples / sec and we have $M$ samples, then the duration $T$ will be $N/F_s$ and then our frequency resolution is the inverse of this which is $F_s/M$. If we zero pad that out to $N$ total samples, the frequency spacing of each bin will decrease to $F_s/N$ but we have not done anything to improve the frequency resolution, or our ability to discern two closely spaced frequencies- it will still be $F_s/M$! So here we note the interesting point that our frequency resolution is really not to do with the sampling rate but to do with the total duration in time of our actual (non-zero padded) data set. Here $T$ is the length of time for the actual data within the window. With zero padding we increase the number of DFT bins which therefore increases the number of frequency samples but it does not increase the frequency resolution! See this post for more details on that with a specific example:
What happens when N increases in N-point DFT
This assumes a rectangular window, which has the narrowest frequency resolution as given by the relationship above (and specifically this is the equivalent noise bandwidth). Any other window used will decrease the frequency resolution further, as detailed in many other posts on here with regards to windowing specifically.
Here is an example demonstrating real and complex frequencies and their DFT:
N = 10;        # Total number of samples
n = 0:9;       # sample index
k = 3;         # frequency index (Fs = N)
y = cos(2*pi*k*n/N);
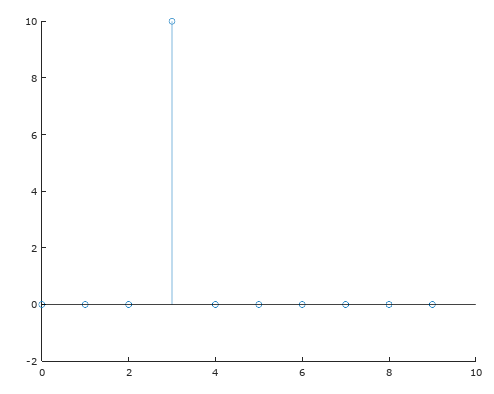
stem(n,fft(y))
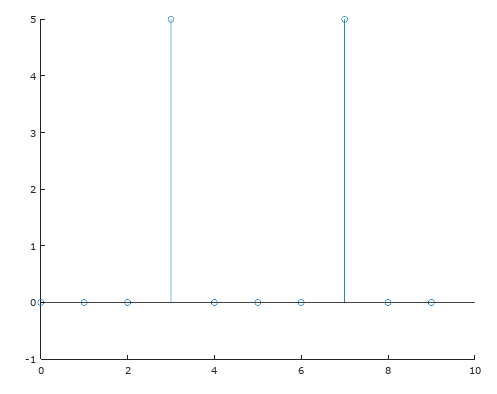
The plot above is for the DFT of the function $y = \cos(3\omega_n)$ where $\omega_n$ is $2\pi/N$. Note that this is the same as $\frac{1}{2}e^{j3\omega_n} +\frac{1}{2}e^{-j3\omega_n}$. Because of the cyclical nature of the DFT described above, $e^{-j3\omega_n} = e^{j(10-3)\omega_n} = e^{j7\omega_n}$, so we see the two DFT bins representing this at bin 3 and bin 7.
Think of the bicylce wheel and the strobe light, if it was rotating 7 cycles per second in the positive direction with the strobe light at 10 cycles per second, it would visually appear to be rotating 3 cycles per second in the negative direction! The upper bins of the DFT represent the negative frequencies. For real signals the negative frequencies are the complex conjugate (equal magnitude, opposite phase) of the positive frequencies, hence we only need to show the frequencies from $0$ to $F_s/2$ in the case of real signals, as we already know what the negative frequencies are.
Below shows the same result for a complex tone at at bin 3 only.
y2 = exp(j*2*pi*k*n/N);
stem(n,fft(y2))
As for the statement by the OP:
halving the window duration would remove every second frequency bin,
but keeping the same window duration and removing every second sample
(halving the sample rate) would correspond to removing the right half
of the bins.
Halving the DFT duration (not the window duration but the window duration will be modified if the DFT duration is less than double the window) would remove every second frequency bin and not impact the remaining bins only under the condition the condition that the contents remaining in the window are either cyclically invariant to the original data set (cascading the remainng window with itself results in the same original data) or there is nothing in the portion of the data that was removed (removing zeros only). Please this post which details this further, knowing what is shown in frequency at that post can equally be described as the time domain.
Effect of changing sample rate, window duration and zero padding on DTFT and DFT
