3
$\begingroup$

I was reading about Noise Figure on Wikipedia (https://en.wikipedia.org/wiki/Noise_figure). There, I saw the following definition:

The noise factor is thus the ratio of actual output noise to that which would remain if the device itself did not introduce noise, or the ratio of input SNR to output SNR.

where noise figure is $10\log_{10} \text{(Noise Factor)}$.

That arises a question in me.

If Noise Figure is given for an amplifier as a constant (for example Noise-Figure=$5.5$dB), since amplifier noise is additive (i.e. its power adds up to the input noise power), then the amplifier noise must be dependent on input noise power, which contradicts with my intuition.

As an example, is an amplifier has gain of $1$ (i.e. no amplification, no attenuation) with a NF of $5.5$dB, it preserves the input signal power, in a sense that $$P_{\text{out}}=G\cdot P_{\text{in}}=P_{\text{in}}$$and $$\sigma^2_{\text{noise,out}}{=G\cdot\sigma^2_{\text{noise,in}}+\sigma^2_{\text{amplifier}}\\=\sigma^2_{\text{noise,in}}+\sigma^2_{\text{amplifier}}}$$ hence $$\text{Noise Factor}={\sigma^2_{\text{noise,out}}\over \sigma^2_{\text{noise,in}}}=1+{\sigma^2_{\text{amplifier}}\over \sigma^2_{\text{noise,in}}}=10^{0.55}=3.55$$and $$\sigma^2_{\text{amplifier}}=2.55\sigma^2_{\text{noise,in}}\qquad\qquad(!!)$$

However, we know that Noise Figure is highly used in practice. Where is my mistake in understanding it?

$\endgroup$
4
  • $\begingroup$ Note that the noise factor is not the ratio of input noise power to output noise power. It is the ratio of input SNR to output SNR. $\endgroup$
    – MBaz
    Commented Mar 4, 2020 at 20:51
  • $\begingroup$ @MBaz, it is no always true, since the noise figure is a ratio of input SNR to output SNR when the input noise is thermal (non-amplified before) $\endgroup$ Commented Jun 25, 2023 at 15:44
  • $\begingroup$ It means that if the noise on the input is amplified and it is higher then added amplifier noise, the effect will be observed less. The ratio of SNRs depends on the input noise power and added amplifier noise power $\endgroup$ Commented Jun 25, 2023 at 15:46
  • $\begingroup$ basically the added amplifier noise is the same and non-dependent on the input noise, and if the input noise >> added noise, the SNR degradation will be small. $\endgroup$ Commented Jun 25, 2023 at 15:52

2 Answers 2

4
$\begingroup$

To answer your question, Noise Figure is the amount of noise that would be added referenced to the input of the amplifier assuming no prior noise amplification has been provided in a properly matched system. This equates to a change in the SNR of the output relative to the SNR of the input, and the input noise level with no other gain would be typically referred to as the "thermal noise floor".
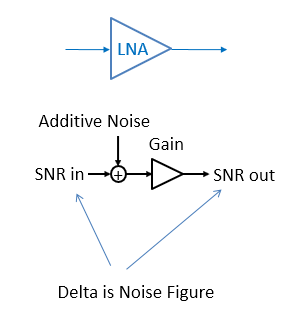
NF Amp Model

So given that, and to your example, if the gain of the amplifier was 1 (0 dB) and the noise figure was 5.5 dB, then in this case the signal out would be equal to the signal in (gain = 1) but the noise out would be 5.5 dB higher than the noise at the input assuming the input noise was thermal noise alone. (and hence if you follow SNR out vs SNR in you see that this would hold).

In order for the total noise to be 5.5 dB higher, this means the amplifier referred to its input has added noise that is 4.1 dB higher than thermal noise, as we see with the sum of the two independent noise powers:

$$5.5 \text{ dB} = 10Log_{10}(10^{0/10}+10^{4.1/10})$$

Interpreting the formula I did above: relative to a 0 dB reference noise floor, adding noise that is 4.1 dB higher will result in a total noise power that is 5.5 dB higher.

Consider if the amplifier had a gain of 10 dB with the same 5.5 dB Noise Figure. Here at the output of the amplifier, the signal would be 10 dB higher but the noise out would be 15.5 dB higher than the noise in. Thus the SNR will have changed by 5.5 dB which is the Noise Figure.

Now to further demonstrate noise figure, consider the same case with adding an additional noise free 10 dB gain amplifier in front of our noisy 5.5 dB NF amplifier: At the input to the noisy amp the signal will be 10 dB higher and the noise will be 10 dB higher relative to the thermal noise floor. Our noisy amp adds +4.1 dB of noise relative to the thermal noise floor, so referenced to the noisy amp input according to this noise figure model, in this case, the total noise will be:

$10Log(10^{10/10}+10^{4.1/10}) = 10.99$ dB above the thermal noise floor.

While the signal will be 10 dB above the input signal level at this point.

(Note this isn't the actual level that would be measured at the input of course but is the "input referenced" noise as measured at the output of the amplifier--as the noise is added in the amplification process).

At the output of our noisy amp, due to its +10 dB gain, the signal will be an additional 10 dB higher, as well as the noise, resulting in a final noise output level that is 20.99 dB above the thermal noise floor. The total change in signal level was +20 dB, while the total change in noise level was +20.99 dB. The change is SNR was therefore only 0.99 dB. This is the Cascaded Noise Figure showing how a prior lower noise amplifier can reduce the overall noise figure of the system. The actual formula for this is given below, but following the details above helps give the background of how this works. The bottom line is that the noise figure is the additional noise that is added referred to the input of the device relative to the thermal noise floor. Increasing signal and noise prior can swamp out this additional added noise later.

$F_T = F_1 + \frac{F_2-1}{G_1} + \frac{F_3-1}{G_1G_2} ...$

Where

$NF = 10Log_{10}(F)$

and gain in dB = $10Log_{10}(G)$

$\endgroup$
6
  • $\begingroup$ I'm not sure but isn't the noise figure different if the received SNR is different.. Surely mathematically. Unless the input signal+noise is assumed to be all signal when just looking at the receiver equipment. Also doesn't the noise figure change depending on where it is in the sequence of cascaded components? $\endgroup$ Commented Nov 27, 2021 at 17:19
  • 1
    $\begingroup$ @LewisKelsey No, the noise figure tells you the added noise due to the receiver alone which would combine with receiver SNR in a sum of powers to get you the C/No. The SNR of the signal has no impact on noise figure, which is specified over the range of frequencies for which your signal occupies. $\endgroup$ Commented Nov 27, 2021 at 17:29
  • 1
    $\begingroup$ @LewisKelsey and to your second question: yes absolutely- the noise figure of the overall receiver is very dependent on component placement. This is what I tried to explain in the final paragraph. $\endgroup$ Commented Nov 27, 2021 at 22:44
  • $\begingroup$ @DanBoschen I think I worked it out, the noise figures are all referenced to the thermal noise floor of the source in the chain, and that's when the $F_1+\frac{F_2 - 1}{G_1}$ formula works. Added thermal noise by the components can be more or less than that kTB. The received signal is considered to be 100% signal, so to calculate the new SNR I guess you add the output noise to the noise in the received noise * gain and then divide gain *signal by it? $\endgroup$ Commented Nov 28, 2021 at 12:05
  • 1
    $\begingroup$ @LewisKelsey Yes but perhaps even simpler- the signal component (where amplified noise at the input is also “signal” goes up by the gain while the thermal noise referred to the input of the component (NOT including amplified thermal noise from prior stages which we now will call “signal”) goes up by the gain plus the noise figure (in dB). I am referring to “signal” here to distinguish from the additional noise each component adds and not the “signal” in signal to noise ratio. Make sense? $\endgroup$ Commented Nov 28, 2021 at 15:07
1
$\begingroup$

Noise figure is given assuming that the source is resistive, at room temperature (usually folks use 300K because it's a nice round number), and matched to the characteristic impedance of the device.

Sometimes when an antenna is pointed at something hot or cold you might see "noise figure with an XXX Kelvin source", but that's peculiar. More often, if a radio is going to be used in a service where the antenna might be pointed to something cold (like the sky, which looks pretty cold at any wavelength that's not absorbed by the atmosphere) then the receiver will be characterized using noise temperature, rather than noise figure.

$\endgroup$

Your Answer

By clicking “Post Your Answer”, you agree to our terms of service and acknowledge you have read our privacy policy.

Not the answer you're looking for? Browse other questions tagged or ask your own question.