1
$\begingroup$

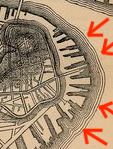
I wish to represent a shore line, old-style, as in the following image (city on the left, water on the right):

enter image description here

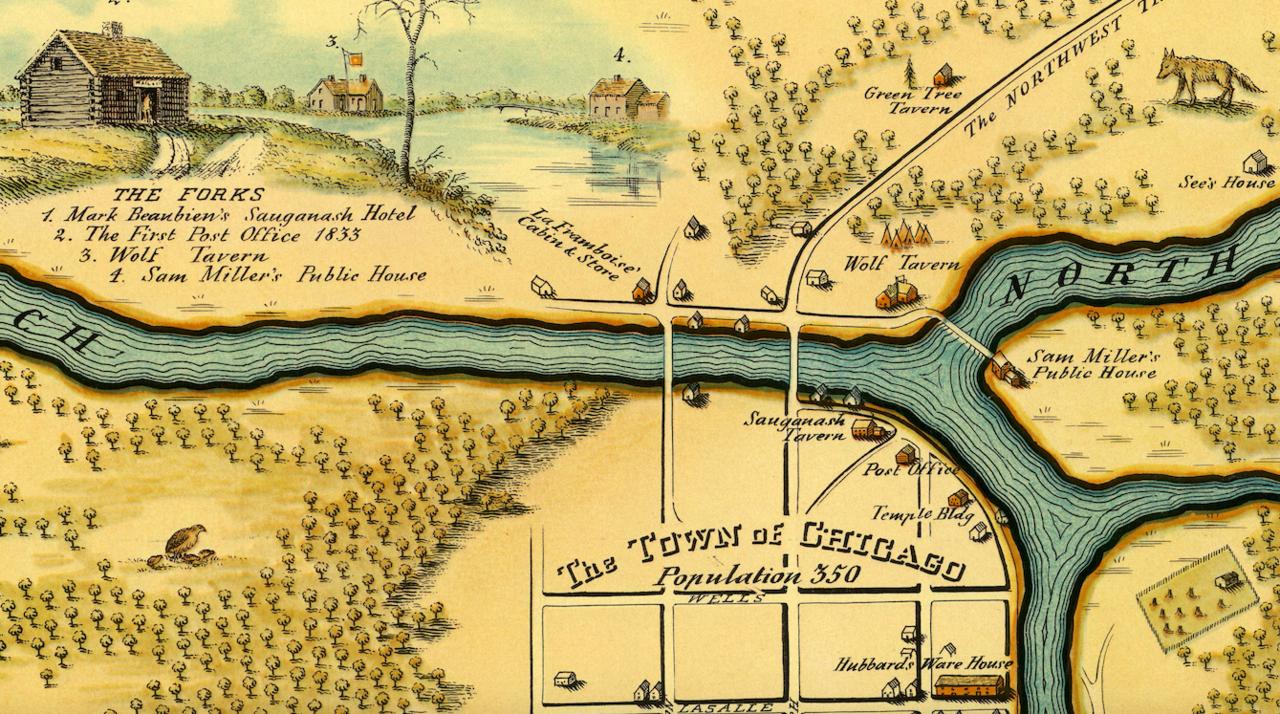
UPDATE: new image for another example of what I'm after, namely the thin lines (given the thick lines). [Credit: https://www.atlasobscura.com/articles/early-map-of-chicago ]

enter image description here

My input is an ordered list of XY points that represent the shore line. I have no clue whatsoever how to compute the additional lines. I have trouble finding resource on the subject through search engines since I'm quite unsure of the correct English terms to describe such an operation.

I've thought of applying a simple dilatation, but this is not the way to go here (in particular, it does not work for concave parts of the shore line).

Any ideas? (and any ideas how to tag this question?)

$\endgroup$
4
  • $\begingroup$ Are you trying to compute the part with many parallel lines that look like contour lines (and probably indicate swampy ground or something like that), or are you trying to compute the part where you've got all those docks or piers or whatever sticking into the channel? $\endgroup$
    – TimWescott
    Commented Feb 8, 2020 at 18:42
  • $\begingroup$ The parallel lines. In the 18/19th centuries, they were widely used on maps just to show the ground/sea separation, not necessarily adding any more information regarding the nature of the shore or body of water. $\endgroup$
    – Silverspur
    Commented Feb 8, 2020 at 23:48
  • $\begingroup$ @Silverspur do you perchance have a higher-resolution image? I really can't see what's happening in the "interesting" parts. $\endgroup$ Commented Feb 9, 2020 at 9:40
  • $\begingroup$ I've added another image. $\endgroup$
    – Silverspur
    Commented Feb 10, 2020 at 12:42

1 Answer 1

2
$\begingroup$

Define a level function curve (L) like this:

$$ L(x,y) = C_0 \cdot x + C_1 \cdot y + C_2 \cdot x^2 + C_3 \cdot xy + C_4 \cdot y^2 .... $$

It has no constanst term. Now, find the best fit to the level curve $L(x,y)=1$. This will yield the values for the coefficients.

Normalize the coefficients so the gradient is of a magnitude you like.

Find the level curves of $L(x,y)=t$ where $t$ is near one.

Finding the best fit is done with Linear Algebra. Finding the level curves is an interative search algorithm.

$\endgroup$
3
  • $\begingroup$ Nice! I've never thought of these lines as contour lines (since, if contour is understood as related to real world elevations underwater, they are not: the lines are always spaced the same, however steep is the see bed). I'm worried the slope of the level function won't be the same along all the shore. Maybe I should also constraint function gradient to keep it equal, except I'm worried of the scale of the problem with such added constraints (I have something like 10^6 points). $\endgroup$
    – Silverspur
    Commented Feb 10, 2020 at 12:40
  • 1
    $\begingroup$ @Silverspur In order to keep your order low ( I wouldn't go above third degree), you are going to have to do it piecewise. With a power of one, you will get parallel lines. For drawing, you can test each pixel to see what its "level" is, and then color it accordingly. In your case, color the pixels that are within $\epsilon$ of a set of $t$ values. $\endgroup$ Commented Feb 10, 2020 at 12:49
  • 1
    $\begingroup$ @Silverspur To do your river ones, construct a midpoint line between the banks. Set one level for the banks and another for the midpoint line and include the constant term. The level function will now generate parallel level curves between the banks and your junctions will work very similar to your image. $\endgroup$ Commented Feb 10, 2020 at 13:28

Your Answer

By clicking “Post Your Answer”, you agree to our terms of service and acknowledge you have read our privacy policy.

Not the answer you're looking for? Browse other questions tagged or ask your own question.