I'm working on an application where I get a video frame that's already segmented into good and bad pixels (as in -- the hardware either coughs up a pixel value or a flag that says "bad"). I want to come up with a figure of merit for the frame that's based both on the number of bad pixels and the amount that they are clumped, with one big clump being worse than a bunch of little ones.
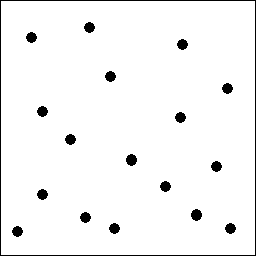
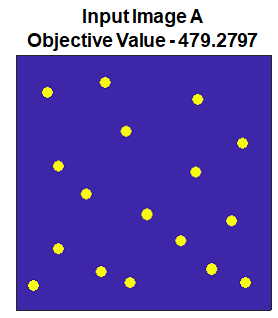
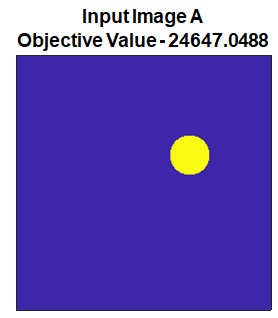
Here's two pictures to illustrate: the left picture has 17 dots 10 pixels in diameter -- it's better, on the theory that the dots are artifacts that can be "seen around". The right picture has about the same number of bad pixels, but they're all in one dot 41 pixels in diameter -- it's worse, on the theory that having so many bad pixels in a clump may occlude something interesting.
Things I can think to do:
- Walk the perimeter of each clump (really inefficient)
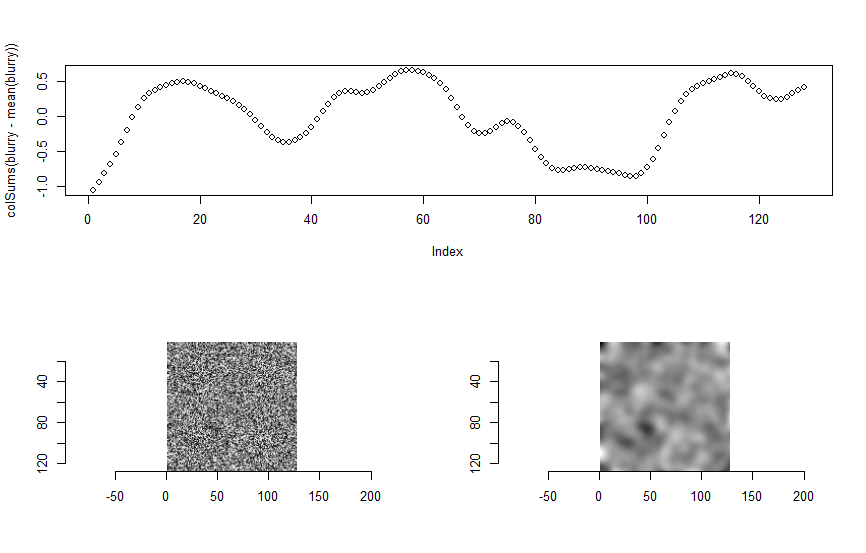
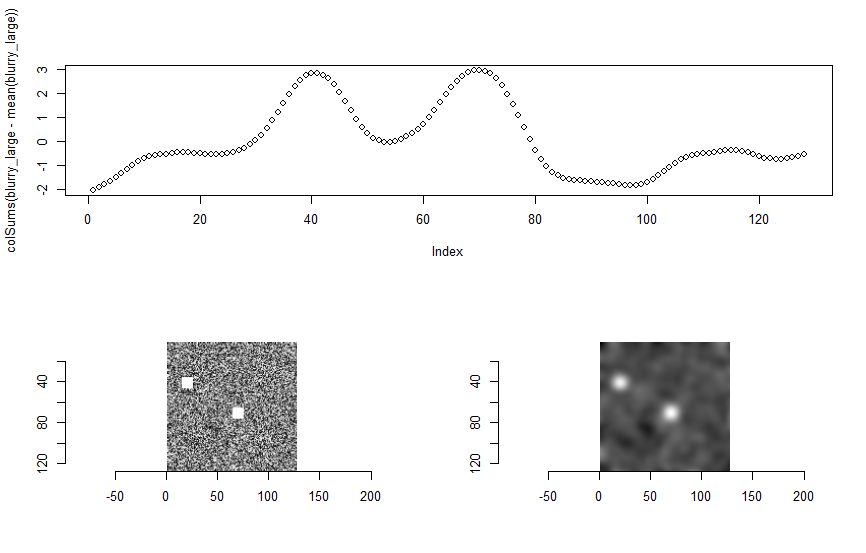
- Low-pass filter (originally I was thinking to use an FFT and look for high frequency content (not terribly efficient, and not terribly accurate, either, I think))
- draw a box around the bad pixels by finding the largest vertical and horizontal extents, and compare the area of that box to the bad pixel count (this could have false negatives if there's a large blob and a few little dots)
Are there known good ways to do this?


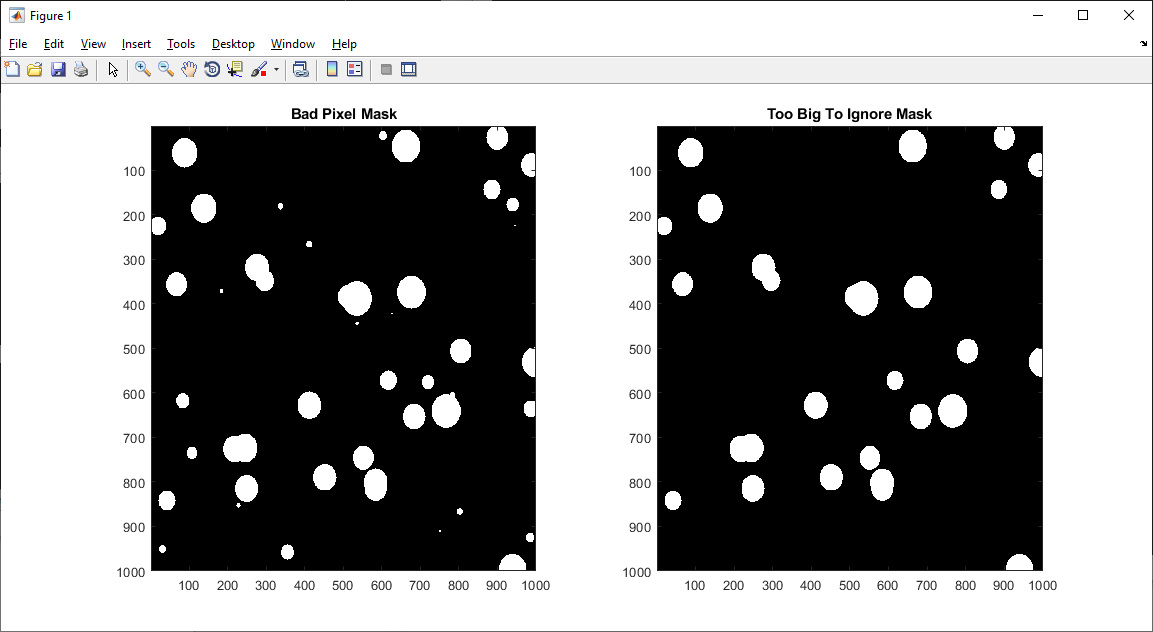
bwlabel()? It seems I don't get what you want to get. $\endgroup$