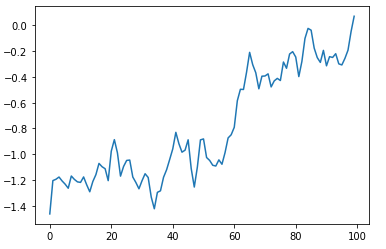
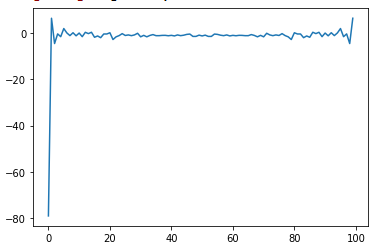
I have applied FFT on a random noisy signal (say for ex, on some stock data). Below figures shows input and output. Now, my question is, how to extract useful peaks (frequencies) from the output? Can FFT be useful on such random data?
-
2$\begingroup$ Something is useful when it does what you want. You have not specified what you want, so it's impossible to say what techniques could be useful. $\endgroup$– MBazCommented Dec 21, 2019 at 16:16
-
$\begingroup$ Who are you calling random? That data isn't random. Can the DFT be used on random data, sure. Do some people do that to test pseudo-random generators (PRG)? Yep. Is that effective? Depends on who you ask, maybe some random guy would know. Try doing a smaller DFT on your range from about 20 to 40. What does it say about the randomness of your data? $\endgroup$– Cedron DawgCommented Dec 31, 2019 at 12:35
1 Answer
First of all you should take the magnitude of the FFT (use abs function) - what you've plotted is just a real part of FFT.
Secondly, depending on what you want to achieve, I would suggest to detrend your signal in order to remove the linear drift. From that point it's all up to you what you want to infer from this data.
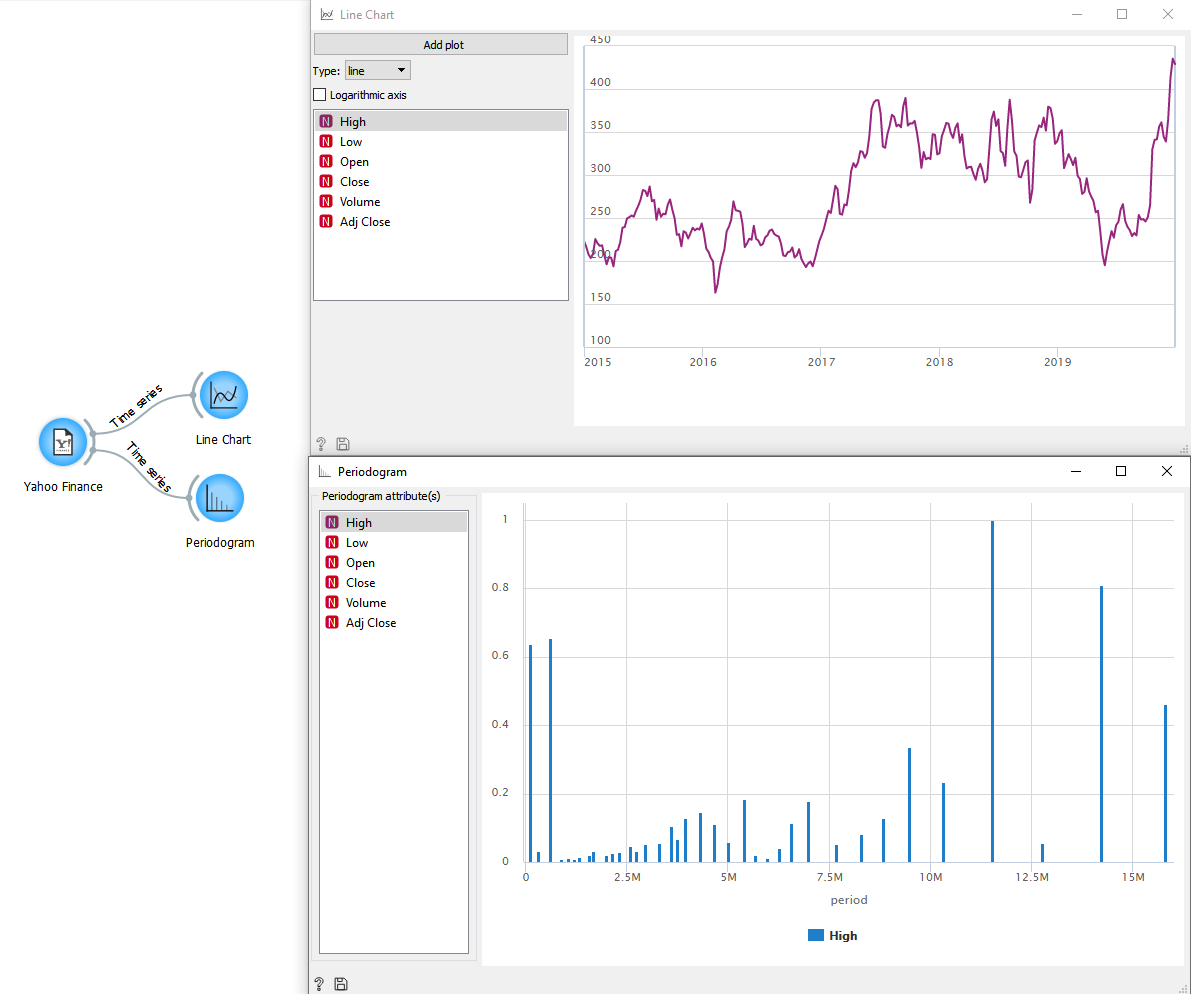
To be honest, I'd suggest you to check out Orange3 with time-series add-on. It's a good starting point for quickly understanding your data. You can either import the CSV file or fetch series directly from Yahoo Finance. Then it's easy to perform any sort of analysis such as periodogram, ARMA, etc. This way you will avoid mistakes using FFT.
-
1$\begingroup$ Orange looks interesting! Thanks for the pointer. :0) $\endgroup$– Peter K. ♦Commented Jan 30, 2020 at 14:30


