Foreword: I am a PhD student and fairly unexperienced with many signal processing and engineering concepts, please be gentle.
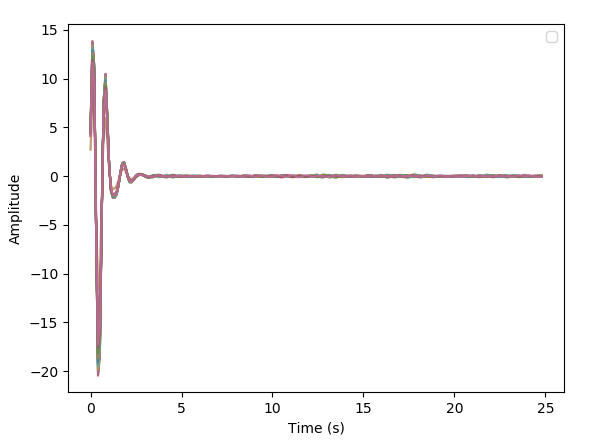
I am attempting to filter out a frequency range of 1Hz to 2Hz from a 2.4GHz CSI amplitude signal, however after applying a butterworth bandpass filter I observe a large spike at the beginning of my signal. If I remove the first 100 or so samples from my signal, this has no effect on the spike. I have attempted this using both Python (with scipy's lfilter), and MATLAB (with butter and filter), and have observed the same behaviour in both. I am aware there are variations of these filter methods, however perhaps I do not understand which one I should be using. I am attempting to replicate this work.
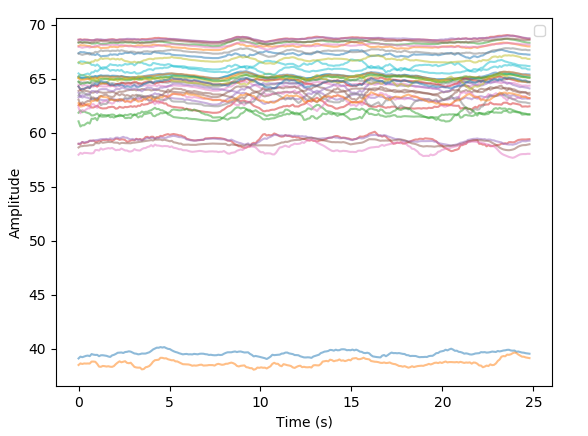
The signal is comprised of roughly 60 OFDM subcarriers, which are all plotted in my example.
Where:
- buttOrd = 2
- fcutlow = 1
- fcuthigh = 2
- Fs = 9.7
MATLAB:
[b, a] = butter(buttOrd, [fcutlow fcuthigh]/(Fs/2), "bandpass");
filterSig = filter(b, a, signal);
Python:
b, a = signal.butter(buttOrd, [fcutlow/(Fs/2), fcuthigh/(Fs/2)], "bandpass")
filterSig = signal.lfilter(b, a, signal)
Above: Unfiltered signal.
Above: Filtered signal.
By reducing the range given to the bandpass filter to something much smaller, like 1Hz-1.01Hz, a smaller, consistent signal can be observed. I understand why a smaller range would produce a different response, but I don't understand the specific behaviour I'm observing.


