1
$\begingroup$

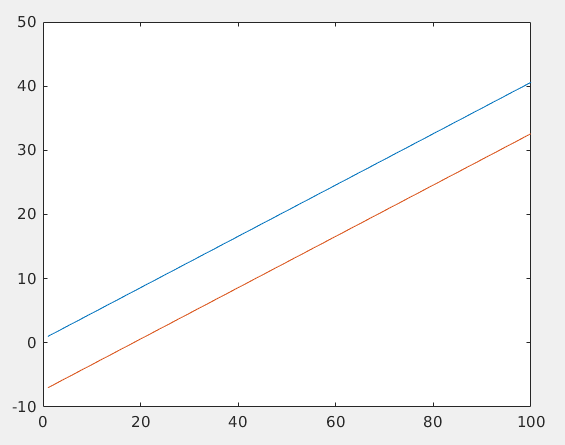
I have zero experience with signal processing, and I am stuck in what I believe to be a very simple problem. I am trying to use the xcorr in matlab to find delay between two signals. The signals are basically two time-series that look like two lines:

enter image description here

I am using the function xcorr in matlab. If I try to run

[acor,lag] = xcorr(Y,X);
[~,I] = max(abs(acor));
lagDiff = lag(I);
timeDiff = lagDiff/Fs

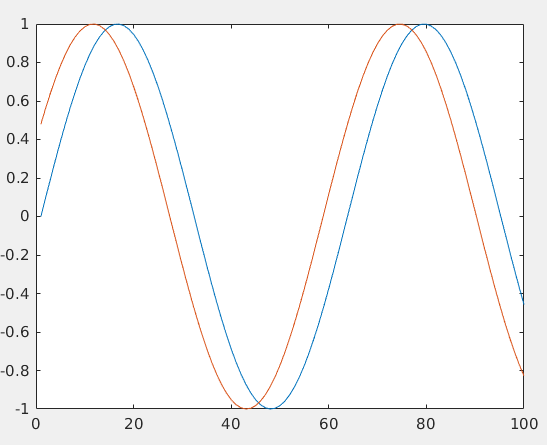
where Y and X are the two lines I get a delay (timeDiff) equal to zero. Which is obviously not true. But if I run the same code on two delayed sinusoids like these:

enter image description here

I get the correct delay (-0.5).

I don't get why with two lines I can't get the right delay. What am I missing?

Here the entire code:

example_sig = 'sinusoid';
% example_sig = 'line';
switch example_sig
    case 'sinusoid'

        Fs = 10;

        t1 = (0:100-1)/Fs;
        t2 = (0:100-1)/Fs;


        X = sin(t1);
        Y= sin(t2+0.5);

    case 'line'
        Fs = 10;

        t1 = (0:100-1)/Fs;
        t2 = (0:100-1)/Fs;

        X = 1 + 4*t1;
        Y = 1 + 4*(t2-2);

end 

[acor,lag] = xcorr(Y,X);

[~,I] = max(abs(acor));
lagDiff = lag(I);
timeDiff = lagDiff/Fs
figure
plot(lag,acor)
a3 = gca;
% a3.XTick = sort([-3000:1000:3000 lagDiff]);

% figure, plot(X),hold on, plot(Y), plot(inc_surf(indx0-100+delay+1:indx))
figure, plot(X),hold on, plot(Y)

Thank you in advance!

$\endgroup$
1
  • $\begingroup$ You currently do not have a delta in the x-axis, but you do in the y-axis. Are you sure your x and y-axes are not swapped on accident? $\endgroup$
    – Envidia
    Commented Oct 31, 2019 at 20:04

1 Answer 1

1
$\begingroup$

If you plot the cross correlation instead of taking the maximum, then I expect you'd see the problem.

The cause is that your signals aren't centered around zero. They have an offset. The cross correlation of two signals with an offset is a kind of triangle looking thing with the peak at zero.

As far as the cross correlation is concerned, your two signal are identical except for the offset - and you normally use a high pass filter or subtract the average of the data points to remove the offset.

Your result is correct and to be expected, it's just not what you wanted.

$\endgroup$

Your Answer

By clicking “Post Your Answer”, you agree to our terms of service and acknowledge you have read our privacy policy.

Not the answer you're looking for? Browse other questions tagged or ask your own question.