0
$\begingroup$

This is more of a conceptual question, so apologies in advance if this is not the correct forum for such questions.

I am trying to find a repeatable and consistent method for removing the baseline of a large number of independently acquired spectra. After an extensive literature search, I am well acquainted with the various methods for baseline removal - including the favored ones for the particular spectra I am dealing with.

However, the method I have used so far (asymmetric least squares) requires me to set some hyperparameters which do not produce consistently good results across the entire dataset. I have tried variations of lambda and p, some of which produce better results on certain spectra, but no combinations as yet produce consistently good results throughout the dataset (>10,000 spectra). The application of the modelling project is such that manual tuning of these hyperparameters for individual spectra is not an option when putting these models into production.

Does the community have a view on a baseline removal approach that is more appropriate for my application?

$\endgroup$
1
  • $\begingroup$ Do you need more feedback? $\endgroup$ Commented Sep 21, 2019 at 12:27

1 Answer 1

0
$\begingroup$

Baseline removal for signals and background filtering in images remain, as far as I am aware of, an ill-posed problem related to source separation. Reasons are legion, mostly around the unresolved question: "how to measure the range of admissible baselines both qualitatively (for the signal specialist) and quantitatively (for the objective)?".

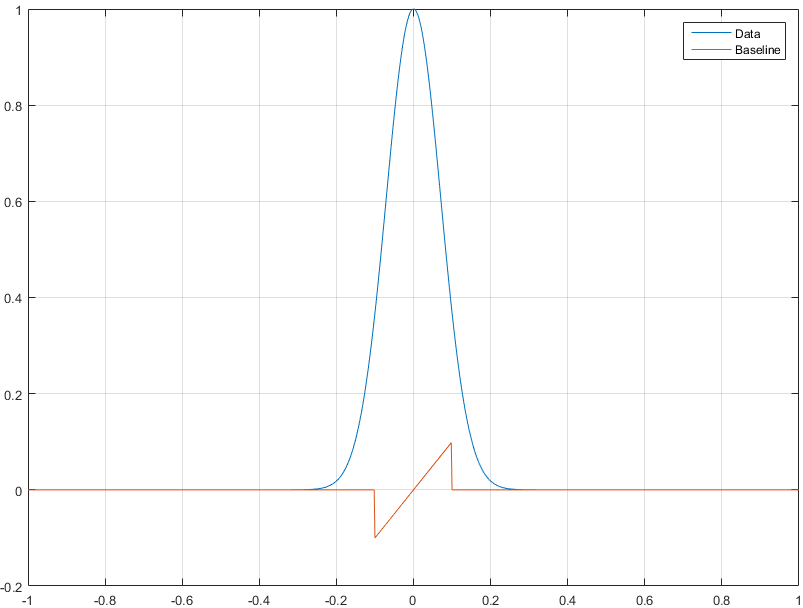
If from one measurement at a time, you want to separate two or three components, this is an under-determined problem. Using asymmetry already induces at least one asymmetry parameter. Using any prior or constraint (gaussianity, positivity, peak symmetry, sparsity) is likely to yield one more parameter each, generally linking two quantities of different dimensions. And even if my objective target is clear, which is seldom the case, many solutions could be valid. For instance, if I am interested in peak area, the baseline below is fine, yet shocking for the data analyst:

strange baseline for a peak

At the present time I see two main options:

  • try to fit baselines globally, not individually, using optimization and algebraic tools (low-rank, NMFetc.) but as numerical data has limited precision and quantization (integer, float), some constraints have to be (machine-dependent) fixed,
  • try to learn baselines of "meaningful subsets", but you have to choose their size, how to weight them, etc. Even deep learning needs a little tuning,
  • try to guess parameters from signal-based heuristics, and a little grid searching.

I admit I still stick to the third option, not yet successful in most instances. Check How to remove or filter the drift problem in measured Strain signal? for a related question and answers.

$\endgroup$

Your Answer

By clicking “Post Your Answer”, you agree to our terms of service and acknowledge you have read our privacy policy.

Not the answer you're looking for? Browse other questions tagged or ask your own question.