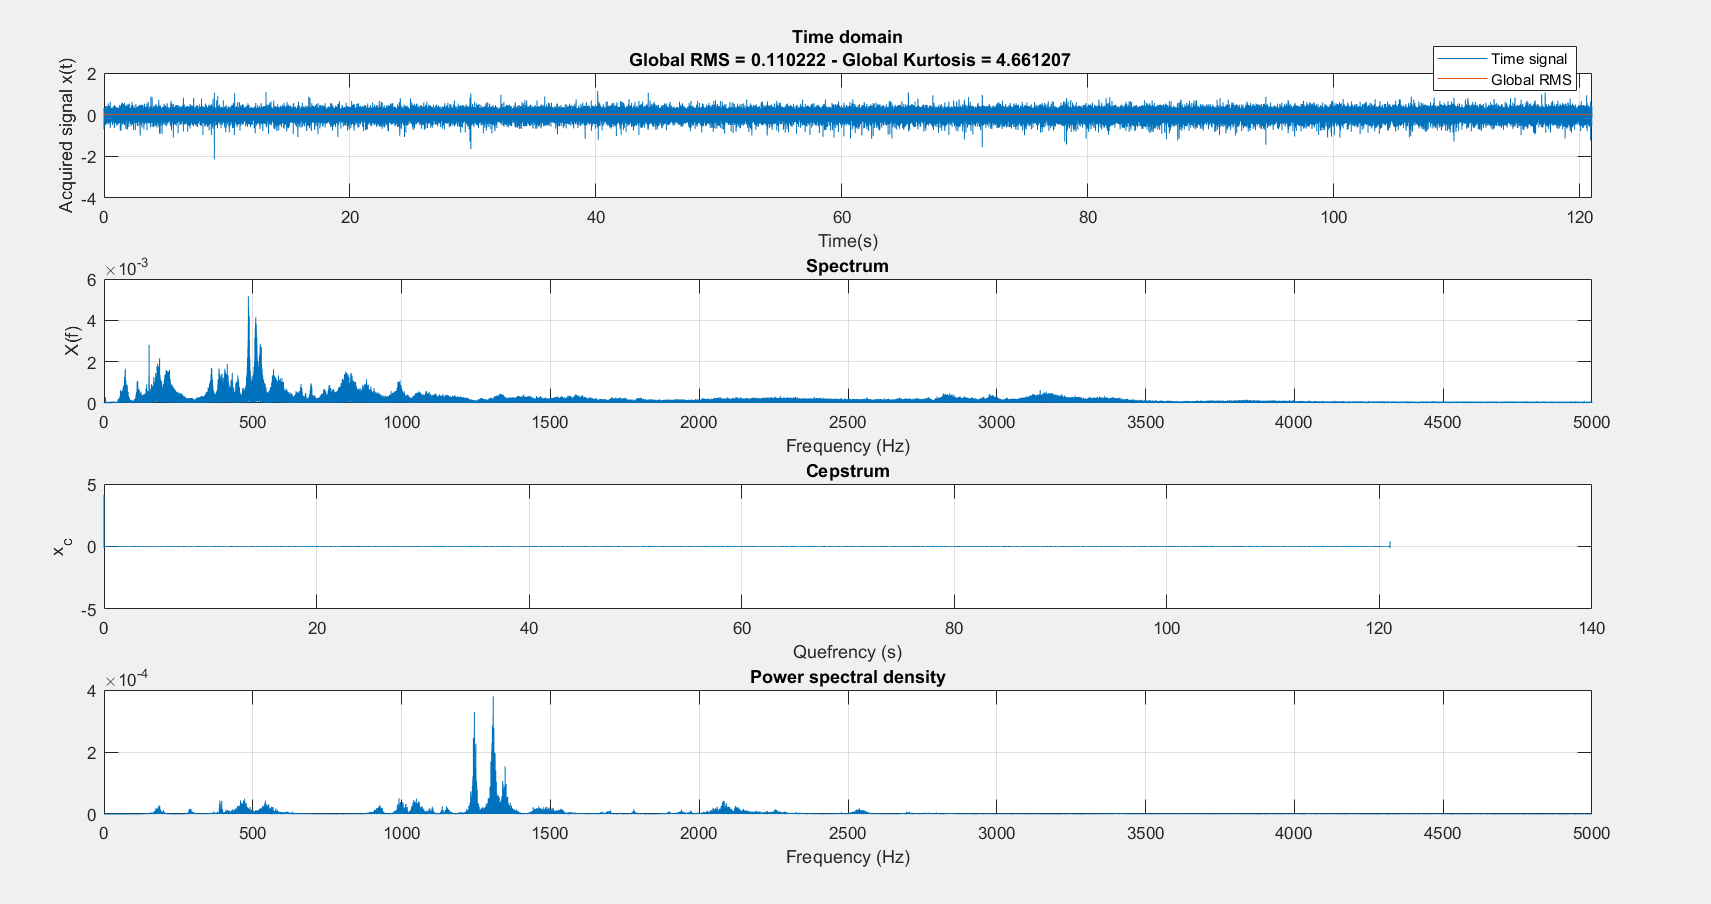
I have a bit complex time signal. When trying to plot its spectrum, I get some weird result. Denoting the time signal as x and time vector as t, whether I use the definition of the cepstrum by typing this formulae xcepstrum = real(ifft(log(abs(fft(x))))); or I use Matlab function cceps I get the same result. The problem is that the result doesn't make any sense. Here is a plot of the signal.
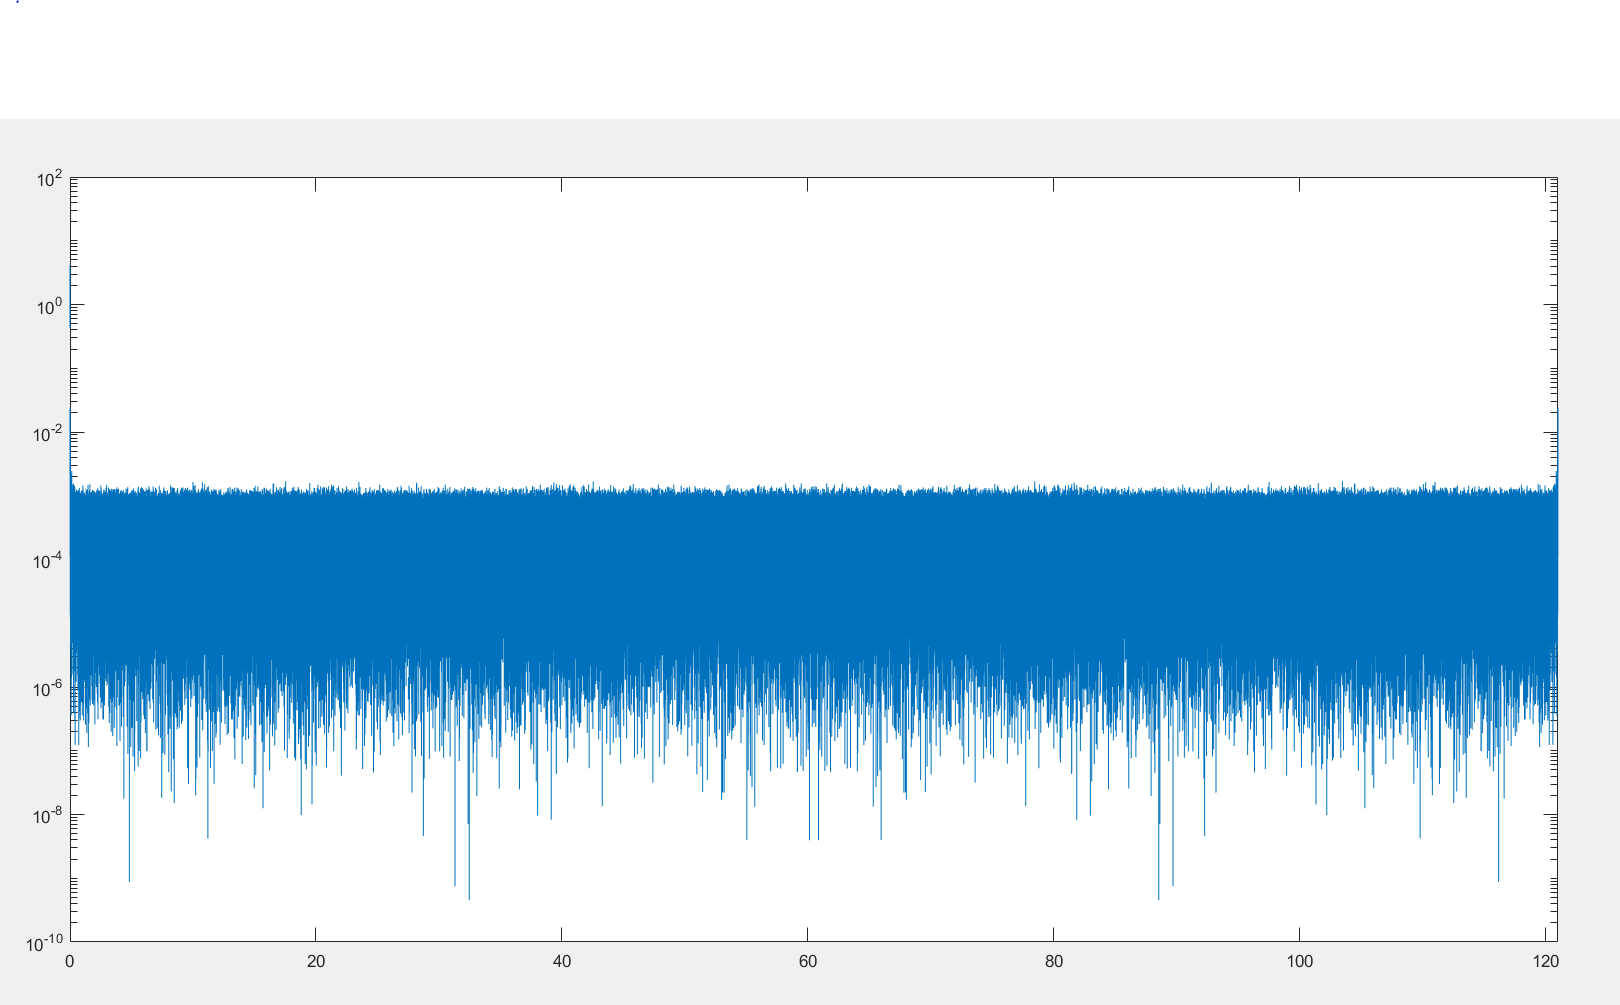
The values that appear as 0 in the cepstrum aren't really zero. Whren plotting using the semilogy function, I get this plot.


