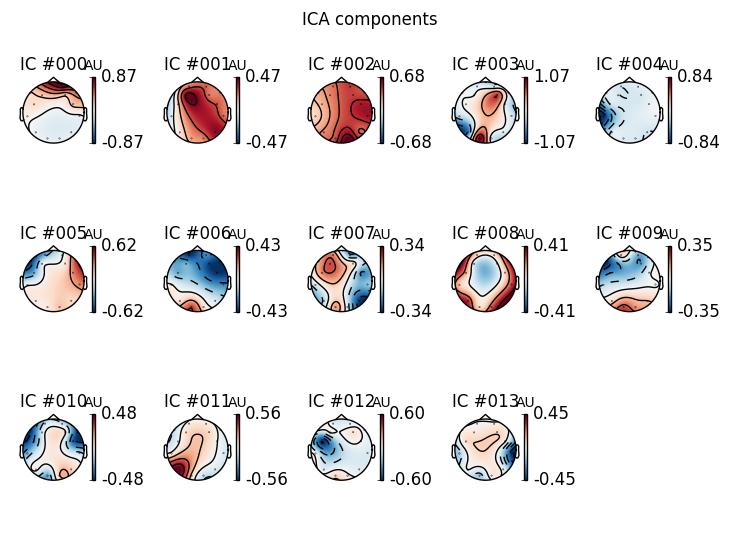
In general, the topographic map describes the distribution of electrical activity across the brain as measured in a number of well known "stations" (electrodes whose position is known) on the scalp.
This electrical activity is the combined result of millions of neurons firing below the skull. The strength of the electrical signal they create is measured across the REFerence electrode and one of the scalp electrodes. In a typical Electroencephalography (EEG) montage, you may have something like 16 to 20 channels (more in special cases).
The Inverse Problem in this case, that is, given the 20 (for example) signals of the EEG, calculate which neurons fired and how is ill-posed because it has a huge number of unknowns (millions of neurons) and only a handful of knowns (20 signals).
What can be done however, is to use Independent Component Analysis (ICA) to decompose the combined electrical activity of millions of neurons in the brain to a small number of independent (in a very specific mathematical sense) components.
In this case, the physical interpretation of this process is that the 20 channel activity is produced by 3,4,5,... independent "sources" within the skull. And, depending on the cognitive task that the subject was going through during data acquisition (whose performance is modulated by their mental state), these independent components might be able to provide some additional information. For example, maybe disease is reducing the number of sources or "changing their location" and so on.
OK, so, what we are really saying in this case is that we are recording the activity of a small number of components within the brain with 20 electrodes at the surface of the brain. We enter all these 20 time series in ICA, and ICA returns:
The Independent Components (the elementary waveforms whose linear combinations generate all 20 original recordings)
The "loadings" for each electrode. Or in other words, the mixing levels, how much of each of the elementary components is required to reconstruct the signal at each electrode.
Essentially now we have the signals of the sources and we are re-constructing the signals at the electrodes.
Since we are now in full control, let's think about what happens with just one elementary waveform, let's call it "IC1". If we now plot the loadings on the positions of the electrodes (and interpolate in between) we get a topogaphic map of the strength of the Independent Component across the surface of the brain and to an extent, we can localise its activity. The same can be done for the rest of the components and this is how these topographic maps are calculated.
In the case of EEG and assuming a "standard" montage, it is possible to generate these general images. In the case of Magnetoencephalography (MEG), you can get the actual positions of the electrodes from the manufacturer to generate these plots accurately.
For more information please see this,this and this papers while for a more detailed overview of the method please see this link. The papers are not "de-facto" papers, but give a good overview of the use of ICA in EEG, both for preprocessing but also for analysis.
Hope this helps.

