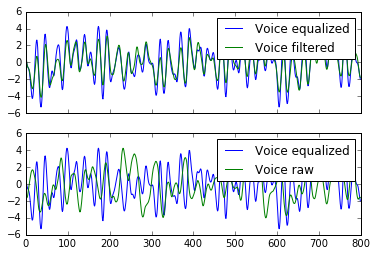
At the current problem I'm working on, I have two signals: One "original" signal that contains audio (voice). The second signal is the same audio file but edited with a frequency equalizer, for example to make all frequencies between $649-677\textrm{ Hz}$ louder.
What I'm trying to achieve now is to "teach" a SCIPY filter to mimic this behavior. Therefore I created a function with two butterworth-filters and try to curve_fit the $x$-data to the $y$-data. The intuition is, that like this the system learns the optimal frequency intervals to mimic the equalizer. Obviously it doesn't work as supposed (no curve fit achieved most of the time. If I achieve a curve fit and apply the filter to the original data, it didn't change at all). Any suggestions?
import numpy as np
from scipy.optimize import curve_fit
from scipy import signal

xdata = voice_1
ydata = voice_2

# Function to optimize, supposed that two bandpass filters are enough
def func(x, p1,p2,p3,p4):
    b, a = signal.butter(2,[p1,p2],btype="band")
    x = signal.lfilter(b,a,x)
    b, a = signal.butter(2,[p3,p4],btype="band")
    x = signal.lfilter(b,a,x)
    return x

# Optimize function to achieve a curve-fit and therefore get the right frequency response in p1,p2,p3,p4
popt, pcov = curve_fit(func, xdata, ydata,p0=(0.5,0.5,0.5,0.5))
What I also tried was creating a xsignal containing of white-noise, creating a ysignal where I changed some frequency levels and calculating a transfer function H as FFT(ysignal)/FFT(xsignal). As soon as I apply this function to other data than white noise the results seem to be wrong as well.

