4
$\begingroup$

At the current problem I'm working on, I have two signals: One "original" signal that contains audio (voice). The second signal is the same audio file but edited with a frequency equalizer, for example to make all frequencies between $649-677\textrm{ Hz}$ louder.

What I'm trying to achieve now is to "teach" a SCIPY filter to mimic this behavior. Therefore I created a function with two butterworth-filters and try to curve_fit the $x$-data to the $y$-data. The intuition is, that like this the system learns the optimal frequency intervals to mimic the equalizer. Obviously it doesn't work as supposed (no curve fit achieved most of the time. If I achieve a curve fit and apply the filter to the original data, it didn't change at all). Any suggestions?

import numpy as np
from scipy.optimize import curve_fit
from scipy import signal

xdata = voice_1
ydata = voice_2

# Function to optimize, supposed that two bandpass filters are enough
def func(x, p1,p2,p3,p4):
    b, a = signal.butter(2,[p1,p2],btype="band")
    x = signal.lfilter(b,a,x)
    b, a = signal.butter(2,[p3,p4],btype="band")
    x = signal.lfilter(b,a,x)
    return x

# Optimize function to achieve a curve-fit and therefore get the right frequency response in p1,p2,p3,p4
popt, pcov = curve_fit(func, xdata, ydata,p0=(0.5,0.5,0.5,0.5))

What I also tried was creating a xsignal containing of white-noise, creating a ysignal where I changed some frequency levels and calculating a transfer function H as FFT(ysignal)/FFT(xsignal). As soon as I apply this function to other data than white noise the results seem to be wrong as well.

$\endgroup$
6
  • 1
    $\begingroup$ "seem to be wrong": how do you figure? could you plot e.g. the in-, reference and output PSDs? $\endgroup$ Commented Jun 13, 2016 at 10:53
  • $\begingroup$ Jomona, you could try a time domain equailizer using your two signals and the Wiener-Hopf equations - see dsp.stackexchange.com/questions/31318/… and mathworks.com/matlabcentral/fileexchange/… . I think this would work quite well for you and be a "least squared error" solution. $\endgroup$ Commented Jun 13, 2016 at 12:33
  • $\begingroup$ "As soon as I apply this function to other data than white noise the results seem to be wrong as well." Are you looking at magnitude and phase of the output separately? $\endgroup$
    – endolith
    Commented Jun 13, 2016 at 15:41
  • $\begingroup$ Thanks for all your comments. Regarding the last one: I make an IFFT and get the signal back into the time-domain. There I only look at the Amplitude over time. @ Dan Boschen: Thanks for the link. This got me to think about the filtering solely in the time-domain. Maybe I can come up with a solution here. $\endgroup$
    – Jamona
    Commented Jun 13, 2016 at 16:38
  • $\begingroup$ I know this is not an answer, but i can't comment yet as i need a 50 reputation to do so... I also know that this is an old post, so i'm hoping the OP can post an answer here. I researched this quite a lot and tried the FFT method which simply did not work because of the noise present in each files, but i have the same exact question as you and it seems to be exactly the solution to my problem, but i'm having a hard time applying the resulting eq... Here is my original question: dsp.stackexchange.com/questions/90194/… I have tried a fe $\endgroup$
    – arno sica
    Commented Dec 9, 2023 at 17:57

1 Answer 1

2
$\begingroup$

Thanks for all your comments. I finally found the answer this article and implemented it in python:https://www.dsprelated.com/freebooks/filters/Time_Domain_Filter_Estimation.html It works pretty well, if you first find the transfer function h(t) with raw and equalized white noise and then apply the function as a filter to any audio data:

import numpy as np
import scipy

def learn_equalizer(signal_x, signal_y, detail_level):
    # Create Toeplitz Matrix
    padding = np.zeros(detail_level, signal_x.dtype)
    first_col = np.r_[signal_x, padding]
    first_row = np.r_[signal_x[0], padding]
    X = scipy.linalg.toeplitz(first_col, first_row)

    # Implement the formula for finding the optimal solution numerically
    X = X[0:len(X)-detail_level,]
    h = np.dot(X.T,X)
    h = scipy.linalg.inv(h)
    h = np.dot(h,X.T)
    equalizer = np.dot(h,signal_y)

    return equalizer

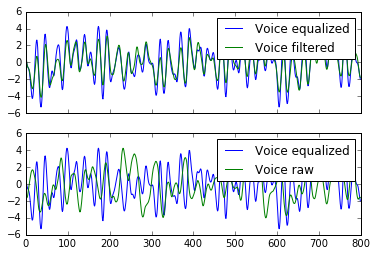
Finally looking at the curves let's consider two plots: One with the raw and equalized signal, to show their differences. The other plot shows the equalized signal and the "mimicked" equalizer. Here you see how good the learned filter is, when applied to real sounds after being trained on white noise.

Signal comparison:

Signal comparison

$\endgroup$

Your Answer

By clicking “Post Your Answer”, you agree to our terms of service and acknowledge you have read our privacy policy.

Not the answer you're looking for? Browse other questions tagged or ask your own question.