this is John BG [email protected]
1.- Avoid doubling segments
If you carry on with the code you have used in your approach:
img=imread('001.jpg');
imshow(img);
img = rgb2gray(img);
img = medfilt2(img);
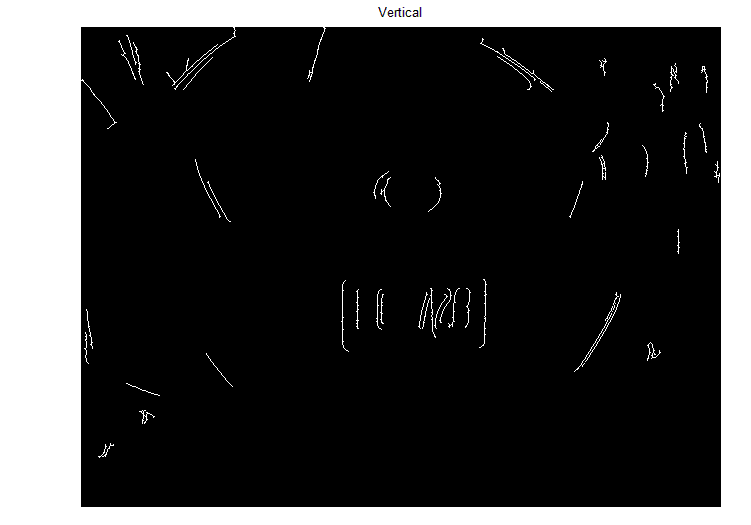
v = edge(img,'sobel','vertical');
v = bwlabel(v);
stats = regionprops(v, 'Area','BoundingBox','Image');
ids = find([stats.Area] > 30 & [stats.Area] < 2000);
vsq = ismember(v,ids);
figure;imshow(vsq)
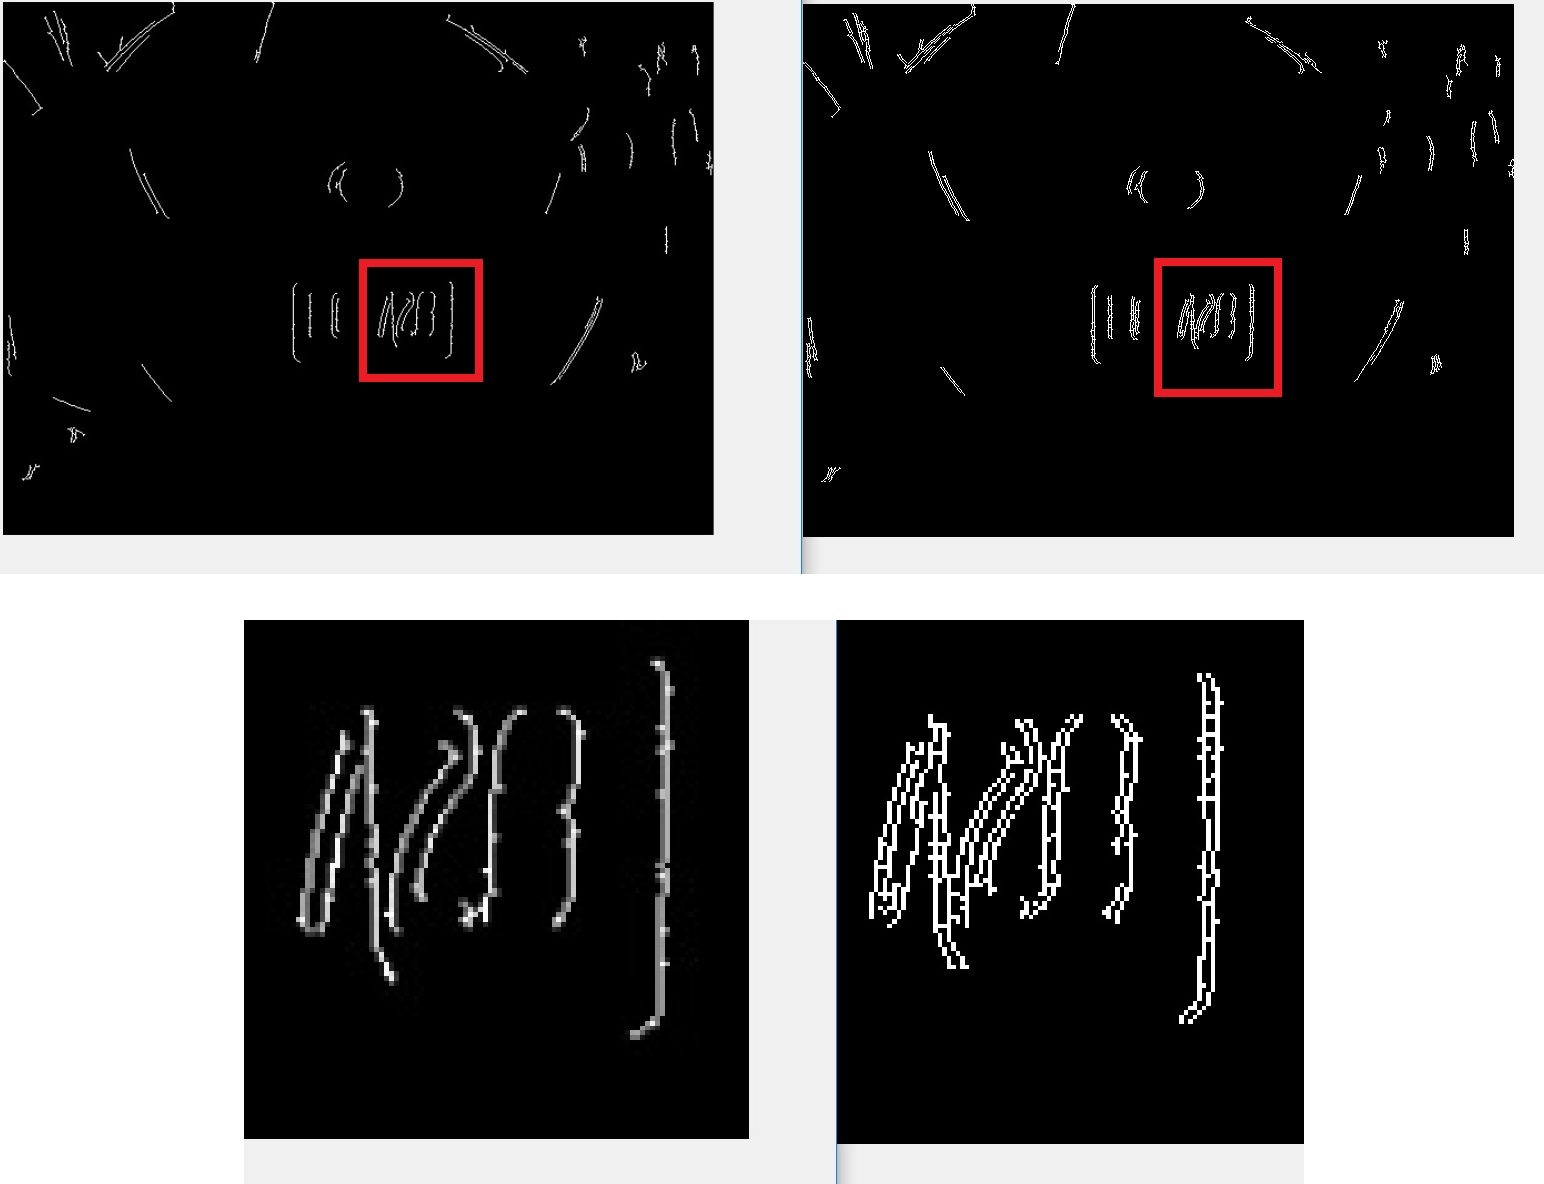
You are adding segments that shouldn't be included, additional lines are added really close
to the lines of the original image, but that shouldn't be there.
While searching for parallel lines it will look as if each of these really
close pairs count as a really parallel pair when in fact there's only one line
So, allow me to instead, suggest the following:
2.- Acquiring image, taking only 1 colour layer, and binarising:
clear all;clc;close all
input_image_filename='001.jpg'
A=imread(input_image_filename);
figure(1);imshow(A)
since all 3 RGB layers have exactly same layers, 1 layer is going to be enough
A1=A(:,:,1)

th1=100
A1(A1>th1)=255;A1(A1<=th1)=0;
figure(2);imshow(A1)
3.- Shrinking Smoothing a bit with command bwmorph
A2=A1;
A2(A2>0)=1;  % same as A2=imbinarize(A1);
A3=bwmorph(A2,'skel',Inf);
figure(3);imshow(A3);
% 003

A4=bwmorph(A3,'tophat',Inf); % not useful
figure(4);imshow(A4);
% 004
4.- Numbering Counting segments
A5=bwlabel(A4,8);
figure(5);imshow(A5)
% 004-2
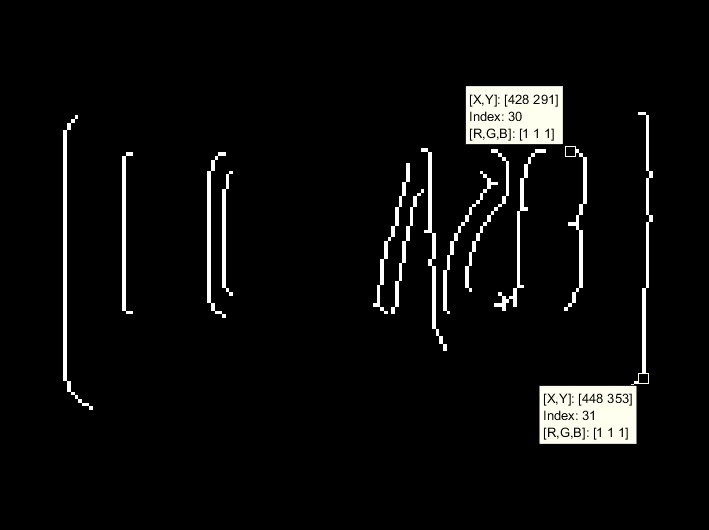
Now, the last figure apparently looks the same as the previous one but in fact now each segment has a
different value despite all segment also look white: all pixels of the straight segment on the far right has
value 31, all 'white' pixels of this segment have actually same value 31.
There's no other segment in the entire figure that has any pixel with value 31.
The segment immediately to the left hand side of the above mentioned
segment labeled with 31, has value 30, and again all pixels of this same
segment have same value 30, while at the same time there's no other
segment in the entire figure with any pixel with values, neither 31 nor 30.
Now we can count how many segments in the image, avoiding the
dangerous doubling highlighted in point 1
range_A5=unique(A5)';
amount_segments=max(range_A5)


amount_segments =
    47
There are 47 segments
5.- What about short shoots?
The objective is to compare segments against each other and tell how parallel they are, compared in pairs.
For the sake of keeping the answer concise let's simplify to linear segments:
No T-junctions No stars or any other segment topology that cannot be
drawn with single pen trace without lifting pen off paper.
5.1.- capture tip points of all segments
A5(1,:)=0;A5(end,:)=0;A5(:,1)=0;A5(:,end)=0; % make sure picture frame, all edge pixels, are black
A4(1,:)=0;A4(end,:)=0;A4(:,1)=0;A4(:,end)=0; % make sure picture frame, all edge pixels, are black

% figure(6);imshow(A5);   % check that there are not white pixels right on edge of picture

[sz1_A5,sz2_A5]=size(A5)                                        % sz2 horizontal sz1 vertical
[wx,wy,v]=find(A5);P=[wx wy];                               % P: all white points

hold all                                                                    % check P contains all white and only white points
for k=1:1:length(P)
    plot(P(k,2),P(k,1),'r*')
end
% 004-3
PA: each element of cell PA contains all pixels of 1 segment
Next, S is going to contain coordinates of all tip points of each segment {[x11 y11 x12 y12] [x21 y21 x22 y22 x23 y23] .. }
S={};                                                                   % coordinates of tip points of each segment {[x11 y11 x12 y12] [x21 y21 x22 y22 x23 y23]  .. }
for k=1:1:length(PA)
   L0=PA{k}
%    hold all                                                           % check all points in L0 define same segment
%    for k10=1:1:length(L0)
%         plot(L0(k10,2),L0(k10,1),'r*')
%    end

   T1=[]
   for k2=1:1:size(L0,1)
        p1=L0(k2,:)                                                  % read white point coordinates
        p1y=p1(1);p1x=p1(2)

            P2=[p1y-1 p1x-1;                                      % coordinates of 8 pixels around p1
               p1y-1 p1x;
               p1y-1 p1x+1;
               p1y p1x+1;
               p1y+1 p1x+1;
               p1y+1 p1x;
               p1y+1 p1x-1;
               p1y p1x-1];

            s2=0
            for k3=1:1:8
                s2=s2+A4(P2(k3,1),P2(k3,2))
            end

            if s2==1                                                   % there's only 1 px adjacent to p1
                T1=[T1 p1x p1y]
            end
   end

    p1_check=T1([1:2:end])                                     % mark all tips found for same segment
    p2_check=T1([2:2:end])
    hold all;
    for k4=1:1:numel(p1_check)
        plot(p1_check(k4),p2_check(k4),'b*')
    end

%    end

       S{k}=T1
end
% 005
5.2.- Choose 2 tips furthest apart as the tip points:
even the apparently more or less straight segment may show more
than 1 pair of tip points
% 005-2
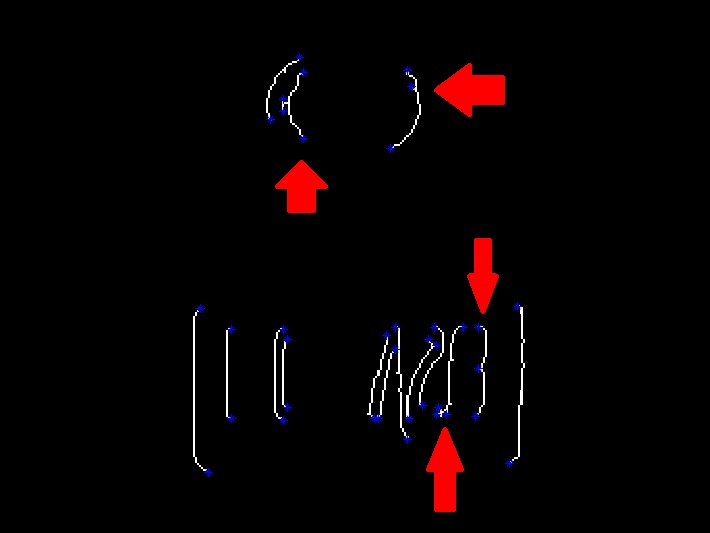
So let's fix this first by choosing as segment tips those only a pair of
points, selecteed among the above ones, selecting those furthest appart.
T2=[0 0 0 0]
for k=1:1:size(S,2)
    L1=S{k}

    ptx=L1([1:2:end])                                               % mark all tips found for same segment
    pty=L1([2:2:end])

    if numel(ptx)>2 more_than_2_tips=1; end
    if numel(ptx)==2 more_than_2_tips=0; end
    if numel(ptx)<2 more_than_2_tips=NaN; end          % error

    switch more_than_2_tips
        case 1
            D=((ptx-ptx').^2+(pty-pty').^2).^.5             % distance matrix
            maxD=max(max(D))
            [nrow,ncol,v]=find(D==maxD)

            ptipx1=ptx(nrow(1))
            ptipx2=ptx(nrow(2))
            ptipy1=pty(ncol(1))
            ptipy2=pty(ncol(2))

            hold all;
            plot([ptipx1 ptipx2],[ptipy2 ptipy1],'ro','MarkerSize',10,'LineWidth',2)
            plot([ptipx1 ptipx2],[ptipy2 ptipy1],'r','MarkerSize',10,'LineWidth',2)
            D(nrow,ncol)
            T2=[T2;ptipx1 ptipy2 ptipx2 ptipy1]

        case 0
            D=((ptx(1)-ptx(2))^2+(pty(1)-pty(2))^2)^.5
            hold all;
            plot([ptx(1) ptx(2)],[pty(1) pty(2)],'ro','MarkerSize',10,'LineWidth',2)
            plot([ptx(1) ptx(2)],[pty(1) pty(2)],'r','MarkerSize',10,'LineWidth',2)
            T2=[T2;ptx(1) pty(1) ptx(2) pty(2)]

        otherwise
    end
end
T2(1,:)=[]
T2 contains all tip points, 2 per segment
% check
ptnx=T2(:,[1 3])
ptny=T2(:,[2 4])
plot(ptnx,ptny,'yo','MarkerSize',10,'LineWidth',2)
Comment: this check is 'more MATLAB' like.
There is really no need for some of the for loops used above. Some habits die hard.
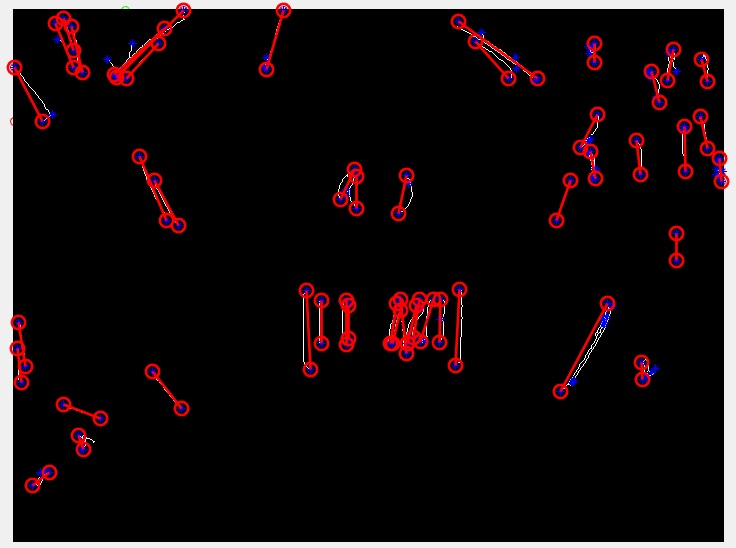
T2: segment tips
M2: segment slopes
6.- How to define, measure, and compare paralellism between 2 given 2D segments.
T2
M2=(T2(:,4)-T2(:,2))./(T2(:,3)-T2(:,1))
7.- Consider Straightness and Parallelism equivalent:
the measurement of parallelism is closely related to the straightness of
the segment compared
in 2D, slope or straightness Inf or -Inf are the same
M2(find(M2==-Inf))=Inf
then the problem is over comparing M2 among all segments
PAR=M2-M2'
degree of parallelism over segment numeral
figure(6);stem(M2);grid on
% 007-1
figure(7);histogram(M2)
% 007-2
However, Instead of considering M2 a direct measure of the degree of parallelism, perhaps it would make sense, in the context of the question,
that it has been mentioned that it's about car plate recognition, yet the
sample image looks like more a biology laboratory petry, perhaps the
angle as degree of parallelism would be more adequate:
PAR_angle=atand(M2)-atand(M2)'
angle in degrees, not radians.
figure(7);stem(atand(M2));grid on
% 007-3
figure(8);histogram(atand(M2),35)
% 007-4

Observation: there are no segments with abs(angle)>100º
Comment: Matrix PAR of parallelism comparison among pairs of segment is symmetric, only one side of the diagonal is needed.
If interested I can show how to add a colour map, standard or custom, mapped to M2 slopes or atand(M2) the angles to visually pair segments with alike degree of parallelism
cmap=colormap(jet)
..
So far the question has been answered, the following points are comments
and alternative solutions that are left open, to be completed if readers
suggest it may be of any help:
%%%%%%%%%%%%%%%%%%%%%%%%%%
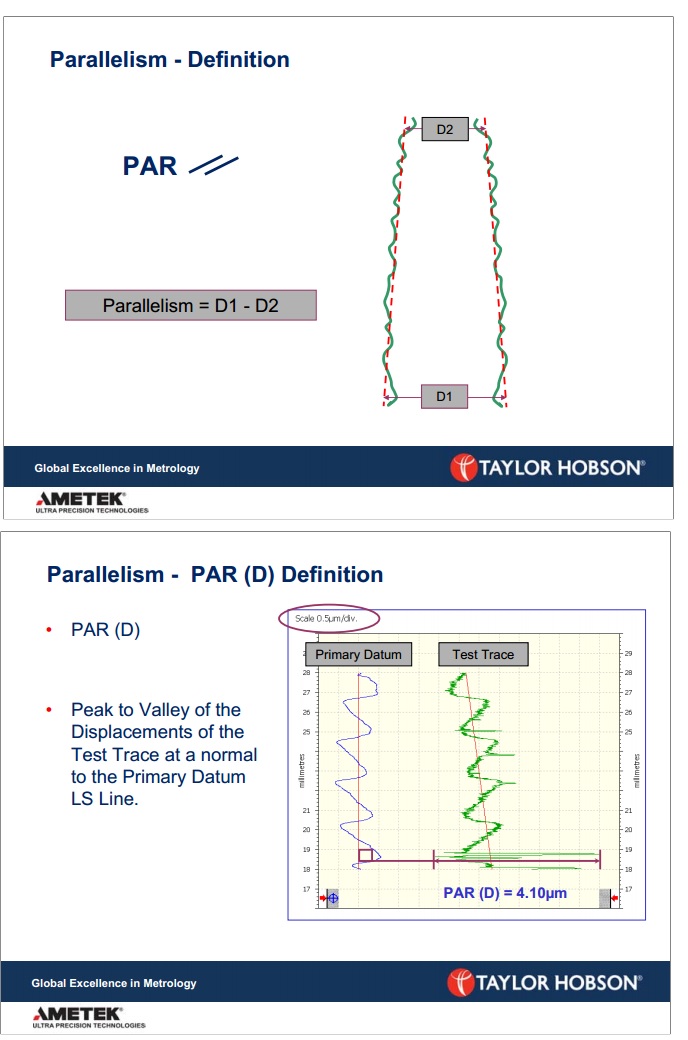
8.- Let's avoid confusions with for instance the industry definition of parallelist of Taylor Hobson
https://www.taylor-hobson.com/-/media/ametektaylorhobson/files/learning%20zone/training%20material/straightness%20and%20%20parallelism.pdf?la=en
008
At Taylor Hobson they use the following criterium:
the closer that D1-D2 is to zero, D1 D2 being distance between tips of 2 segments
But TH calls it the more parallel the segments
are, but this is more a measure of symmetry than 2D segments.
And given the large amount of segments, what if the tips get crossed and
D1 D2 show erroneously larger than they should?
**9.- Euclidean definition of parallel lines:
pair of straight lines on a plane which do not meet.**
Comment: Allow the word 'line' to be preserved for straight segments, adjacent pixels that preserve
same slope with the immediate neighbours.
I found an equivalent definition of parallelism to the Euclidean one:
**Any 2 segments in the initial figure of this question can be considered to be highly parallel if
all the beams joining 2 'equivalent' or 'paired' pixels, each pixel in different
segment, meet the following:
a.- All beams have same slope
b.- All beams have same length**
this way 2 shapped segments where one is the translated copy of the other, for instance
(SS CC LL), with null relative rotation, this is same as with same attitude and same amount of
pixels: such original and translated copy would be maximally parallel.
But 2 concentric circles are parallel, acording this the Euclidean definition or parallel lines,
yet they are never straight regarless of the points considered.
To measure beams slopes and lengths between any arbitrary pair of
segments, one has to first solve 2 obstacles:
avoid pegs, and T junctions generating an excessive and
unnecesary amount of beams
9.1.- Remove pegs
9.2.- Segments don't have same length
To reduce the workload while supplying this answer I am going to restrict this
point 9.2 to the following start figure, this procedure can easily be
escalated to the rest of segments in the initial figure attached to the question:
10.- Measuring beams angle (slope) and length
Since an accurate measurement of the degree of parallelism has already been supplied in point 7.
I will close this answer leaving points 8, 9, 10 open to the interest of any reader, if contacted
those point will be developed accordingly.
%%%%%%%%%
Sending compact script, just let me know where to by email.
if you find this answer useful would you please be so kind to consider marking my answer as Accepted Answer?
To any other reader, if you find this answer useful
please consider clicking on the arrow-up vote link
thanks in advance for time and attention
John BG
[email protected]

