0
$\begingroup$

I've tried to implement STFT in functional way in Python. I've got code such as below:

def genSpectrums_dft(x, w, N, dft_func = fp.fft):
    hN = N / 2
    M = len(x)
    hM1 = int(math.floor((M + 1) / 2))
    hM2 = int(math.floor(M / 2))
    wM = w(M)
    w_sum = sum(wM)
    xw = x * wM / w_sum
    dft_buffer = np.concatenate(
        (xw[hM2:], np.zeros(N - hM1 - hM2), xw[:hM2])
    )
    X = dft_func(dft_buffer)
    mX = 20 * np.log10(abs(X[:hN]))
    pX = np.unwrap(np.angle(X[:hN]))
    return mX, pX

def genSpectrums_stft(x, w, M, N, H, dft_func = fp.fft):
    hM1 = int(math.floor((M + 1) / 2))
    hM2 = int(math.floor(M / 2))
    x_ext = np.concatenate((np.zeros(hM2), x, np.zeros(hM2)))
    lv = np.arange(len(x) / H + 1)
    wM = w(M)
    w_sum = sum(wM)
    xlv = np.array([x_ext[l * H:l * H + M] / w_sum for l in lv])
    return tuple(
        np.transpose(np.array(X))
        for X in zip(
            *[genSpectrums_dft(xl, w, N, dft_func) for xl in xlv]
        )
    )

Full working code is available here (Python, numpy, scipy and matplotlib required to run it).

When I run my code for any wave, STFT magnitude spectrum seems to be quite good, but STFT phase spectrum always looks like this: phase spectrum from genSpectrums_stft function
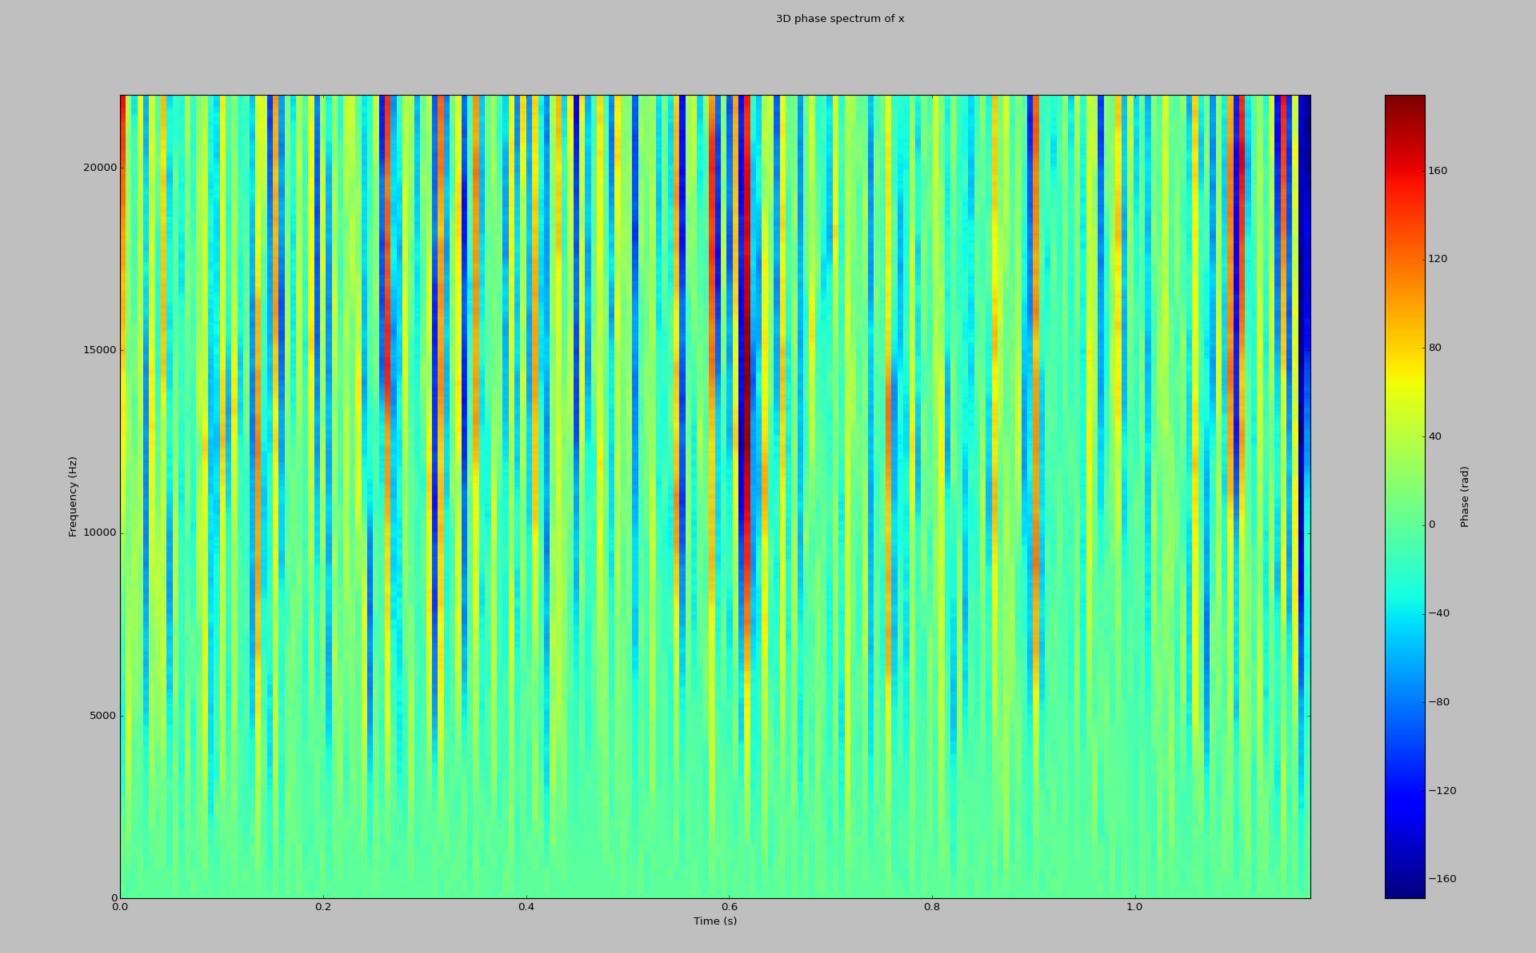
But as far as I know it should rather look like this:

certainly right solution

Both these spectrums have been generated from the same wave and the second parameters. The second one has less frequencies. Why my phase spectrum has these strange vertical lines?

I've got a few remarks rewarding my code:

  1. I am almost positive that finding dft spectrums works correctly
  2. Though the spectrums distinct, when I inverse the process, I get something really similar to the input

If you are not familiar with functional programming, I don't mind if you correct my mistakes in structural way, but the most important thing for me is to understand the problem with my code.

$\endgroup$
1
  • $\begingroup$ @Jazzmaniac already answered your question. Nevertheless you should revise your code for potential mistakes - there are some. For example one is that you generate white noise using randint function which produces uniform but not normal distribution. $\endgroup$
    – jojeck
    Commented Feb 1, 2015 at 11:35

1 Answer 1

1
$\begingroup$

You are unwrapping the phase along the wrong axis. You are obviously interested in the phase change of the frequency bins along the time axis in order to say something about the local phase coherence.

$\endgroup$
7
  • $\begingroup$ Do you mean unwrapping in DFT? If yes, why this DFT spectrum generating works correctly as such? Why generating signal from the spectrums works correctly as well? Unfortunately I am not so familiar with the concept of unwrapping. $\endgroup$
    – pt12lol
    Commented Feb 1, 2015 at 11:19
  • $\begingroup$ Unwrapping changes the phase by multiples of 360 degrees, which means the spectrum and IDFT will be identical. Should only makes a difference in continuity along the x axis of your plot. Not y. $\endgroup$
    – hotpaw2
    Commented Feb 1, 2015 at 13:02
  • $\begingroup$ @hotpaw2, since he is plotting cumulated phase it does make a difference. Modulo $2\pi$ unwrapping changes nothing by definition. Unfortunately there is no time-frequency cumulant of the phase function, so that one has to decide which axis is preferred. (This lack of a global cumulant, or "phase potential", is closely related to the Heisenberg-group and its uncertainty relation.) I'm not sure I'm understanding your comment correctly, but I just wanted to clarify. $\endgroup$
    – Jazzmaniac
    Commented Feb 1, 2015 at 14:01
  • $\begingroup$ Ok, but pX in genSpectrums_dft is one-dimentional array. I can't see how I can unwrap it along another axis. Could you explain it? $\endgroup$
    – pt12lol
    Commented Feb 2, 2015 at 7:42
  • $\begingroup$ Isn't the solution for the problem returning diff(xpX, axis = 0) instead of just xpX (as it is now) in genSpectrums_stft function? I am sorry if my questions are silly, but I am quite new in the DSP. $\endgroup$
    – pt12lol
    Commented Feb 2, 2015 at 8:06

Your Answer

By clicking “Post Your Answer”, you agree to our terms of service and acknowledge you have read our privacy policy.

Not the answer you're looking for? Browse other questions tagged or ask your own question.