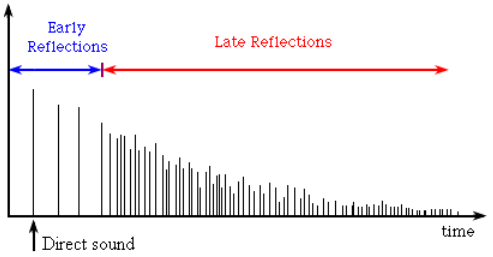
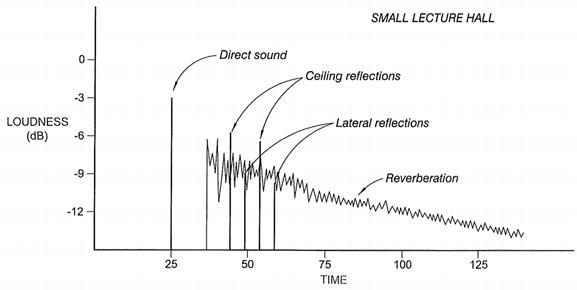
I have sound files that contain recordings of an impulse signal in a room.
I'd like to make such a plot from it. I basically want to compare early reflections.
How do I go about it? Is just taking the waveform, pulling the absolute values and plotting it in bar/impulse form the right way? Or is this just an idealized form? If this is all wrong, could anyone point me towards the correct way of comparing early reflections in a plot form?


