0
$\begingroup$

I have a question about an FFT. I have recorded the vibration of a gearbox with a sampling rate of 48 kHz. The speed of the input is 50 Hz, the speed of the output is 12.5 Hz. At a sampling rate of 48 kHz I have 48000 data points per second and after the output rotates 12.5 times per second I have (48000/12.5) 3840 points per rotation.

Does it make a difference if I use only 3840 points for the FFT (i.e. 1 revolution) or if I use 48000 points and thus have 12.5 revolutions?

If someone has literature on this or can explain to me whether there are rules for this, I would be very grateful.

$\endgroup$
5
  • $\begingroup$ It depends on what you need this data for. More samples would give you smaller frequency bins (more frequency resolution) at the expense of longer computation time. The highest frequency that you'll be able to capture at 48kSps is <24kHz. $\endgroup$
    – axk
    Commented Mar 15, 2020 at 14:06
  • $\begingroup$ I would like to use the data to be able to use ML algorithms to predict whether a gear (gear damage, bearing damage) is defective or not. $\endgroup$
    – Hustler
    Commented Mar 15, 2020 at 14:32
  • $\begingroup$ What are the expected frequencies of vibration, and what do you expect to learn from the vibrational signal? You need to know those to proceed, and if you know those then you don't need to know the rotation rate, at least not directly. $\endgroup$
    – TimWescott
    Commented Mar 15, 2020 at 14:44
  • $\begingroup$ That's the problem. It's an EOL test. It is not known beforehand what can be defective. Therefore it is difficult to determine a certain frequency. I am currently training a CNN and would like to know which signal length is most useful. If one revolution of the output is enough or if it is more reasonable to take several revolutions. $\endgroup$
    – Hustler
    Commented Mar 15, 2020 at 14:52
  • $\begingroup$ @Hustler. Hi. I've never worked on a machine vibration problem before, but something just occurred to me. If you see a narrow spectral peak in your FFT spectral magnitude samples you might relate the frequency (vibrations/second) of that spectral peak to a shaft's rotational velocity and how many rollers (or balls) are in the bearing between that shaft and the gear box housing. Just a thought. $\endgroup$ Commented Mar 15, 2020 at 17:22

3 Answers 3

3
$\begingroup$

@Hustler. Hi. I suggest you use all 48000 vibration samples. As a general rule: In mathematical analysis of measured data it's preferred that you use all available data to estimate some physical quantity. If you perform 48000-point DFTs (discrete Fourier transforms) your first DFT bin frequency will be zero Hz and your DFT bin spacing will be (as jithin said) 1 Hz. Your full spectrum analysis width will be zero –to- 24000 Hz. When you see a narrow spectral peak in your DFT spectral magnitude samples you can relate the frequency (vibrations/second) of that spectral peak to some gear in your gear box by knowing the gear's rotational velocity and how many teeth the gear has. If you are forced to use radix-2 FFT (fast Fourier transform) software, I suggest you zero-pad your 48000 samples out to a length of 65536 samples (2^16 samples) and then perform a 65536-point FFT. In that situation the FFT spectral bin spacing will be 48000/65536 = 0.7324 Hz and your full spectrum analysis width will again be zero –to- 24000 Hz.

$\endgroup$
1
$\begingroup$

For 3840 points, the frequency resolution between each bin is 48k/3840 = 12.5Hz. Hence you should see 2 peaks at bin 1 (corresponding to 12.5Hz) and bin 3838 (corresponding to -12.5Hz since this is a real signal).

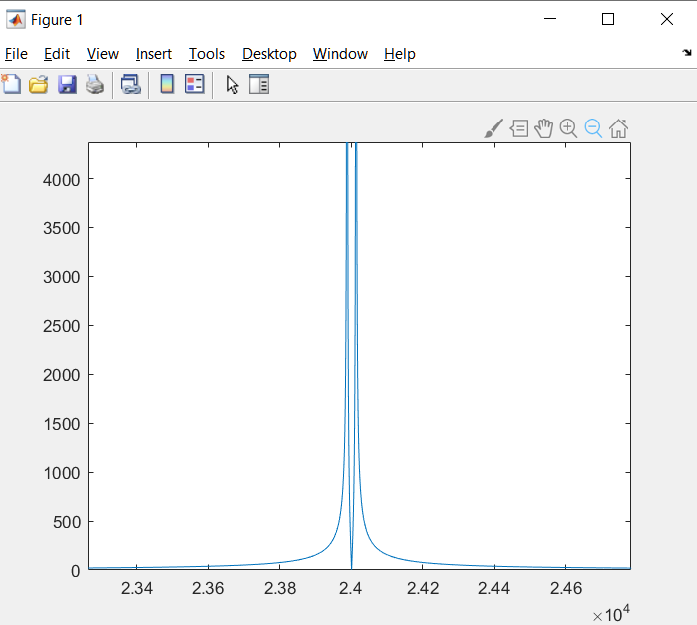
If you use 48000 points, resolution of each bin is 1Hz. Now, 48000 points cannot be represented as integer multiple of 3840 points (which correspond one revolution). Here what you will actually see 2 distinct peaks along with artefacts on either side because of this cycle-length mismatch.

enter image description here

Code for simulation

n=1:48000;
x = cos(2*pi*12.5*n/48000);

plot(abs(fftshift(fft(x))))

There is plenty of literature available in the form of books and university lectures. You can google about 'DFT of sine wave' as a start (since your signal has only single frequency of 12.5Hz. You can also search dsp.se for related questions and answers.

$\endgroup$
4
  • $\begingroup$ Many thanks for the information. I would like to check the gearboxes for defects using ML algorithms. However, I do not know beforehand at which frequency the defect will occur. $\endgroup$
    – Hustler
    Commented Mar 15, 2020 at 14:36
  • $\begingroup$ You want to detect the frequency at which peaks occur? $\endgroup$
    – jithin
    Commented Mar 15, 2020 at 16:36
  • $\begingroup$ My goal is that the machine learning algorithm can decide whether the transmission is good or bad. $\endgroup$
    – Hustler
    Commented Mar 15, 2020 at 17:38
  • $\begingroup$ @Hustler. Hi. I suggest you check out the article at the following web site: researchgate.net/publication/… $\endgroup$ Commented Mar 15, 2020 at 17:57
0
$\begingroup$

It’s been a while, but I recall: a missing gear tooth would have a “beat frequency” aka “ modulation frequency” of 1/revolution. The frequency of the transmitted vibrations will be much different, higher. Think of hitting a bell with a hammer 12 times a second.

$\endgroup$

Your Answer

By clicking “Post Your Answer”, you agree to our terms of service and acknowledge you have read our privacy policy.

Not the answer you're looking for? Browse other questions tagged or ask your own question.